HORMONES 2014, 13(2): 268–279
DOI: 10.1007/BF03401341
Makarios Eleftheriades,1 Panagiota Pervanidou,2 Homeira Vafaei,3 George Vaggos,4 Ismene Dontas,5 Katerina Skenderi,6 Neil J. Sebire,7 Kypros Nicolaides8
1Embryocare, Fetal Medicine Unit, First Department of Pediatrics, Athens University Medical School, Aghia Sophia Children’s Hospital, Athens, Greece
2Childhood Obesity Clinic, First Department of Pediatrics, Athens University Medical School, Aghia Sophia Children’s Hospital, Athens, Greece
3Department of Obstetrics and Gynecology, Faghihi Hospital, Shiraz University of Medical Sciences, Shiraz, Iran
4Second Department of Obstetrics and Gynecology, Athens University Medical School, Aretaieio Hospital, Athens, Greece
5Laboratory for Research of the Musculoskeletal System “Th. Garofalides”, School of Medicine, University of Athens, Athens, Greece
6Laboratory of Nutrition and Clinical Dietetics, Harokopio University, Athens, Greece
7Department of Paediatric Pathology, Great Ormond Street Hospital for Children, and UCL Institute of Child Health, London, UK
8Harris Birthright Research Centre for Fetal Medicine, King’s College Hospital, London, UK
Address for correspondence:
Makarios Eleftheriades, Embryocare, Fetal Medicine Unit, 194 Alexandras Avenue, 10522, Athens, Greece, Tel.: +30 210 6441100 / +30 6944 223060, Fax: +30 210 6441102, 77 Kyprou Str, Papagou, 15669, Athens, Greece, Tel.: +30 210 6833936, E-mail: makarios@hotmail.co.uk & makarioseleftheriades@gmail.com
Received 08-09-2013, Accepted 01-11-2013
Abstract
OBJECTIVE: This experimental study aimed to prospectively investigate the impact of combinations of prenatal and postnatal food manipulations on the metabolic profile of adult offspring.
DESIGN: On day 12 of gestation, 67 timed pregnant rats were randomized into three nutritional groups, control: standard laboratory food; starved: 50% food restricted, FR; fat-fed: fat-rich diet, FF. Seven hundred and seventy-four (774) pups were born on day 21 and culled to 8 (4 males, 4 females) per litter to normalize rearing. Rats born to starved mothers were later subdivided, based on birthweight (BiW), into fetal growth restricted (FGR) and non-FGR. The pups were then weaned to the diet of their fostered mother until one year old. Thus, 12 groups were studied: 1. CONTROL/CONTROL: 14 rats, 2. CONTROL/FR: 12 rats, 3. CONTROL/FF: 15 rats, 4. FGR/CONTROL: 16 rats, 5. FGR/FR: 10 rats, 6. FGR/FF: 15 rats, 7. non-FGR/CONTROL: 10 rats, 8. non-FGR/FR: 17 rats, 9. non-FGR/FF: 10 rats, 10. FF/CONTROL: 15 rats, 11. FF/FR: 14 rats, and 12. FF/FF: 13 rats. During sacrifice, body weight (BW) and liver weight (LW) were measured (expressed in grams) and concentrations of serum glucose, triglycerides, HDL and NEFA were determined.
RESULTS: Postnatal food restriction, compared to control diet significantly reduced BW (p=0.004, p=0.036, p<0.001, p=0.008) and LW (p<0.001) in all study groups. Postnatal control diet significantly increased BW in non-FGR compared to FGR rats (p=0.027). No significant differences were detected in biochemical parameters (excluding NEFA) between FGR and non-FGR, regardless of the postnatal diet.
CONCLUSIONS: Interaction between prenatal and postnatal nutrition produces distinct metabolic profiles. Apart from BiW, prenatal diet had an important impact on the metabolic profile of the adult offspring, implying that intrauterine events should be considered in the estimation of the metabolic risk of an individual, independently of BiW.
Key words: Fat-fed, Fetal Growth restriction, Food restriction, Perinatal nutritional manipulation
INTRODUCTION
The interaction between genetic and environmental factors determines the physical growth and metabolism of an individual and its biological propensity to health and disease. Accumulating data from epidemiological and experimental studies indicate that “early-life events” (prenatal and early postnatal) can initiate changes in gene expression which determine not only the risk for postnatal disease but also an individual’s response to the postnatal environment.1-9 Nutrition is one of the environmental variables with the widest range of effects on physical growth, metabolism and brain development.10,11
Animal studies have demonstrated that manipulation of the fetal or neonatal environment can lead to altered metabolic and/or cardiovascular function. Most of these manipulations have been dietary and mainly include global caloric restriction, reductionof dietary protein content or dietary fatsupplementation.12-21 The majority of studies have not distinguished between the effects of maternal diet during pregnancy and those during the lactating period since the same diet has continued postnatally until weaning. The contribution of maternal diet during the suckling period is also important as organ development and maturation obviously continue after birth. Moreover, mismatch between fetal and postnatal environments through manipulation of postnatal diet could be the basis of disease manifestation according to the ‘Predictive Adaptive Response’ hypothesis.22
According to the hypothesis of fetal origins of adult disease, prenatal exposure to excessive or deficient nutrition alters adipocyte development (adipogenesis). These alterations involve a relatively permanent increase in the ability of adipose tissue to form new cells and to store lipids in existing adipocytes (lipogenesis).23,24The process of adipogenesis occurs mainly during late prenatal and early postnatal life and is strongly influenced by the nutritional environment at this time point. The number of adipocytes remains fairly stable during adulthood, showing a very low turnover rate of adipose cells, providing evidence that events during both fetal and early postnatal life are vital for the development of adipose tissue.25
Furthermore, obesity and diabetes have been associated with the deleterious effect of high NEFA levels on β-cell function and their relationship to the phenomenon of glucotoxicity.26
The aim of this experimental study was to investigate prospectively the impact of prenatal and postnatal food manipulation on weight status and the metabolic profile of the offspring at one year of age. More precisely, it was to examine the combined effects of a) prenatal starvation, b) fat feeding or c) standard diet, with postnatally a) restricted, b) fat or c) standard diet on the growth and metabolism of one-year offspring Wistar rats. We hypothesized that the mismatch of prenatal and postnatal nutritional status might have adverse effects on metabolism in adulthood. Furthermore, we hypothesized that apart from birthweight, which can be influenced by prenatal adverse events, it may be the prenatal adverse event itself combined with postnatal diet that has a great influence on the metabolic profile of the adult offspring.
EXPERIMENTAL ANIMALS AND METHODOLOGY
This is part of a larger study involving the effects of prenatal and postnatal food manipulation on metabolism, body composition, organ weight and tissue morphology of the offspring at one year. The study was designed by the Fetal Medicine Foundation and the Harris Birthright Research Centre for Fetal Medicine, King’s College Hospital, London, UK, and it was conducted at the Experimental Laboratory at Aretaieion University Hospital in Athens, Greece.
RAT MODEL OF PRENATAL AND POSTNATAL FOOD MANIPULATION
All studies were approved by the Animal Research Committee of the Aretaieion Hospital Experimental Laboratory at Aretaieion Hospital, Athens, Greece, and guidelines established by Aretaieion Hospital’s Animal Research Committee, Ethical Committee and Standards of the Greek State and European Community on the Protection, Care and Use of Animals for experimental purposes were followed throughout the experiment. All efforts were taken to minimize pain or discomfort.
Sixty-seven (67) first-time pregnant Wistar rats were obtained at 11 days of gestation (Harlan Animal Research Laboratories, The Netherlands) and housed individually in standard rat cages with free access to water. The rats were kept in the same room with constant temperature and humidity and on a controlled 12-hour light to dark cycle. A model of rat dams that were either normally fed or underwent 50% food restriction or dietary fat supplementation during pregnancy was used.
At 12 days of gestation, timed pregnant rats were randomized into one of the following three nutritional groups:
1. Control Diet Group: continued on an ad libitum diet of standard laboratory food (4RF25, Mucedola, Milan, containing 22% protein, 3.5% fat and 50.5% carbohydrates, metabolizable energy 2789 kcal/kg);
2. Starved Group: receiving 50% food restricted diet that was determined by quantification of normal intake in the ad libitum fed rats;
3. Fat-Fed Group: receiving a fat-rich diet (standard laboratory food enriched with 20% animal lard, Mucedola, Milan);
The respective diets were given from 12 days of pregnancy to term and throughout the 25-day lactation period.
THE OFFSPRING
Rat dams gave birth normally on day 21; 24 hours after birth, the pups were culled to 8 (4 males and 4 females) per litter to normalize rearing. In order to differentiate the impact of prenatal food restriction and birthweight on postnatal heath, pups that were born from food restricted mothers were further divided into two subgroups:
i) FGR group: including prenatally starved neonates with mean body weight at birth < -2SD of the mean body weight of the prenatal normally fed pups;
ii)non-FGR group: prenatally starved neonates with mean body weight at birth > -2SD of the mean body weight of the prenatal normally fed pups.
All neonates were cross-fostered in order to distinguish between the effects of prenatal and postnatal food manipulation and to avoid bias caused by selective maternal deprivation stress. We accordingly cross-fostered pups so that the offspring of mothers fed on a standard diet during pregnancy were suckled by normally fed, food restricted and fat-fed dams. The same cross-fostering procedure involved the offspring of food restricted and fat-fed mothers. Thus, 12 groups were studied:
1) normally fed prenatally / normally fed postnatally (CONTROL/CONTROL);
2) normally fed prenatally / food restricted postnatally (CONTROL/FR);
3) normally fed prenatally / fat-fed postnatally (CONTROL/FF);
4) food restricted prenatally (FGR) / normally fed postnatally (FGR/CONTROL);
5) food restricted prenatally (FGR) / food restricted postnatally (FGR/FR);
6) food restricted prenatally (FGR) / fat-fed postnatally (FGR/FF);
7) food restricted prenatally (non-FGR) / normally fed postnatally (non-FGR/CONTROL);
8) food restricted prenatally (non-FGR) / food restricted postnatally (non-FGR/FR);
9) food restricted prenatally (non- FGR) / fat-fed postnatally (non-FGR/FF);
10) fat-fed prenatally / normally fed postnatally (FF/CONTROL);
11) fat-fed prenatally / food restricted postnatally (FF/FR);
12) fat-fed prenatally / fat-fed postnatally (FF/FF).
Litters were left undisturbed until the 25th postnatal day. On postnatal day 26, the offspring of all groups were weaned to the same diet that their fostered mother was receiving during the lactation period. All offspring continued on the diet until one year of age (Figure 1).
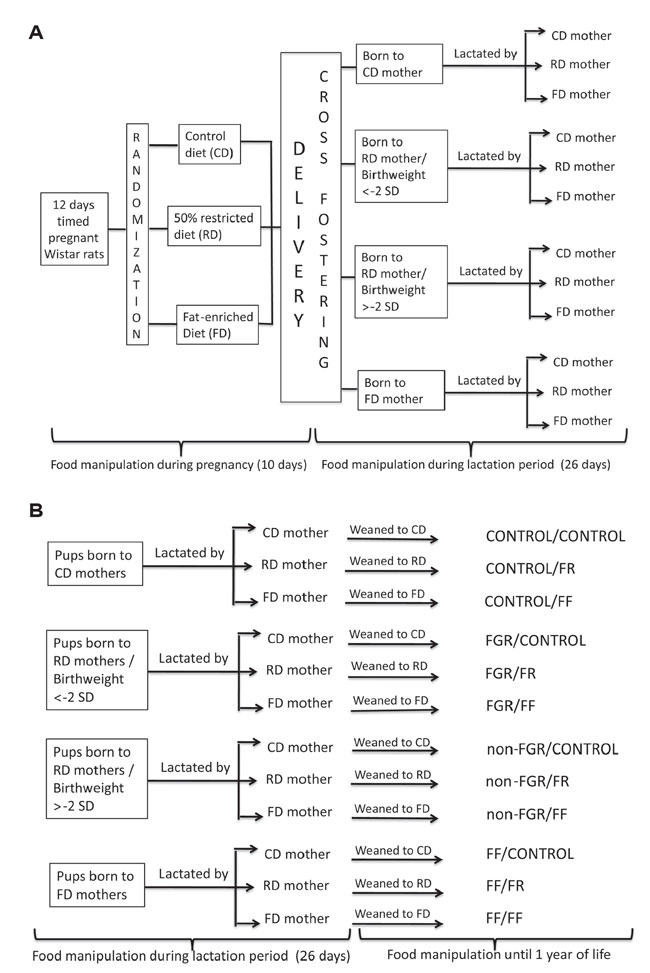
Figure 1. A & B. Experimental design of the study.
In this paper we analyze and discuss data produced by the three types of post-weaning food manipulation (control diet, food restriction and high-fat diet) on the four groups produced by prenatal and during lactation nutrition assignment (CONTROL, FGR, non-FGR and FF). We further focus on the comparison of the impact of postnatal food manipulation (control diet, food restriction and high-fat diet) on the two groups of prenatally food restricted animals (FGR and non-FGR).
SERUM BIOMARKERS AND TISSUE COLLECTION
At the time of sacrifice (one year of age), all rats were deeply anesthetized under isoflurane anesthesia (5%) and blood was taken via abdominal aorta puncture by using a needle (size 0.50 × 16 mm) to collect 2-3 ml of blood. Serum was centrifuged at 1600 rpm for 15 min and stored at -80°C until analyzed. The whole liver was then quickly removed and its weight was measured.
During the study period, due to the expected limited quantity of the blood samples, we decided to measure the standard metabolic parameters used in the clinical practice and comprising the metabolic syndrome. Determination of plasma glucose, triglycerides, total cholesterol, HDL-cholesterol and NEFA was performed by enzymatic colorimetric assays using commercially available kits (Alpha Wassermann Diagnostics, Woerden, The Netherlands) on an automated analyzer (ACE Sciapparelli Biosystems, Fairfield, IN, USA). Quality control procedures relating to the measurements of glucose, triglycerides, total cholesterol, HDL-cholesterol and NEFA were also performed.
STATISTICAL ANALYSIS
Statistical evaluation was performed using Statistical Package for the Social Sciences Software, version 19.0. (SPSS Inc, Chicago, IL, USA). Continuous variables are presented as mean ± standard deviation, while categorical variables are presented using absolute numbers (n) and frequencies. The level of significance was set to ≤0.05. Variables were presented as mean values + standard deviation (SD) using analysis of variance (ANOVA), while relations between variables were assessed by Tukey’s HSD for multiple comparisons. Further analysis of the impact of postnatal food manipulation on prenatally starved groups was assessed using non-parametric procedures due to the small sample (group) sizes (Mann-Whitney and Kruskal-Wallis tests).
RESULTS
Overall 774 rats were born. One hundred and ninety-two (192) animals were born to normally fed mothers [weight grams (mean ± sd): 7.92 ± 0.84], 204 to fat-fed [weight grams (mean ± sd): 8.78 ± 0.91] and 378 to starved mothers [weight grams (mean ± sd): 6.29 ± 0.78].
At one year of age, 161 rats (83 males and 78 females) of the following 12 groups were sacrificed: 1. CONTROL/CONTROL: 14 rats (7 males and 7 females), 2. CONTROL/FR: 12 rats (6 males and 6 females), 3. CONTROL/FF: 15 rats (7 males and 8 females), 4. FGR/CONTROL: 16 rats (7 males and 9 females), 5. FGR/FR: 10 rats (10 males), 6. FGR/FF: 15 rats (7 males and 8 females), 7. non-FGR/CONTROL: 10 rats (8 males and 2 females), 8. non-FGR/FR: 17 rats (9 males and 8 females), 9. non-FGR/FF: 10 rats (2 males and 8 females), 10. FF/CONTROL: 15 rats (8 males and 7 females), 11. FF/FR: 14 rats (6 males and 8 females), 12. FF/FF: 13 rats (6 males and 7 females).
Animal group characteristics at one year of age are shown in Table 1.
1. Rats fed control diet prenatally
Mean values (± SD) of body weight (BW) liver weight (LW) and serum biomarkers are presented in Table 2. Rats of the CONTROL/FR group had significantly lower BW compared to the CONTROL/CONTROL and CONTROL/FF groups (p=0.004 and p<0.001, respectively). LW of the CONTROL/FR group was significantly lower compared to the CONTROL/FF groups (p=0.011). The CONTROL/FF group showed significantly higher levels of glucose compared to the CONTROL/CONTROL and CONTROL/FR groups (p=0.006 and p=0.010, respectively)and significantly higher levels of triclycerides compared to the CONTROL/FR group (p=0.018). NEFA levels were significantly lower in CONTROL/FR and CONTROL/FF (p<0.001 and p=0.057, respectively) and HDL levels were higher in CONTROL/CONTROL rats compared to the CONTROL/FR group (p=0.050) (Table 2).
2. Prenatally food restricted rats (birthweight <-2SD of the mean body weight of the prenatal normally fed pups)
Mean values (± SD) of BW and serum biomarkers are presented in Table 3. Rats of the FGR/FR group had significantly lower BW compared to the FGR/CONTROL group (p=0.036). However, LW of the FGR/FR group was significantly lower compared to both the FGR/CONTROL and FGR/FF groups (p=0.017 and p=0.005, respectively). The FGR/FF group showed significantly higher levels of glucose and triglycerides compared to the FGR/FR groups (p=0.036 and p<0.001, respectively). HDL levels were significantly higher in FGR/CONTROL rats compared to the FGR/FF group (p=0.018) (Table 3).
3. Prenatally food restricted rats (birthweight >-2SD of the mean body weight of the prenatal normally fed pups)
Mean values (±SD) of BW and serum biomarkers are presented in Table 4. Standard diet postnatally significantly increased BW in the non-FGR/CONTROL group compared to the non-FGR/FR and non-FGR/FF groups (p<0.001 and p=0.002, respectively). Food restriction postnatally significantly decreased LW in the non-FGR/FR group compared to the non-FGR/CONTROL and non-FGR/FF groups (p<0.001 and p<0.001, respectively). High-fat diet postnatally significantly increased triglyceride levels in the non-FGR/FF group compared to the non-FGR/CONTROL and non-FGR/FR groups (p=0.004 and p<0.001 respectively) (Table 4).
4. Prenatally fat-fed rats
Mean values (± SD) of BW and serum biomarkers are presented in Table 5. Food restriction postnatally significantly decreased BW, LW and triglyceride levels in the FF/FR group compared to the FF/CONTROL and FF/FF groups (p=0.008 and p=0.001, respectively, for BW; p<0.001 and p<0.001, respectively, for LW and p<0.001 and p<0.001, respectively, for triglycerides) (Table 5).
5. Postnatal control diet in prenatally starved animals
There was no statistically significant difference in BW and LW between the CONTROL/CONTROL, FGR/CONTROL and non-FGR/CONTROL groups. However, the non-FGR/CONTROL rats showed significantly increased BW and lower levels of NEFA compared to the FGR/CONTROL group (p=0.027 and p=0.022) (Figure 2A, 2B).
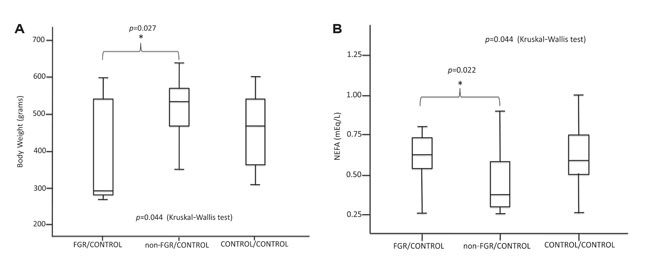
Figure 2. A & B. Postnatal control diet on prenatally starved animals.
6. Postnatal starvation in prenatally starved animals
There was a statistically significant difference in LW between CONTROL/FR and both prenatally starved groups (FGR/FR and non-FGR/FR; p<0.001 and p<0.001, respectively). In both prenatally starved groups HDL and NEFA levels were significantly increased compared to CONTROL/FR (p=0.037 and p=0.059, respectively, for HDL; p<0.001 and p<0.001, respectively, for NEFA), whereas triglyceride levels were significantly decreased (p<0.001 and p<0.001, respectively) (Figure 3A, 3B, 3C, 3D).
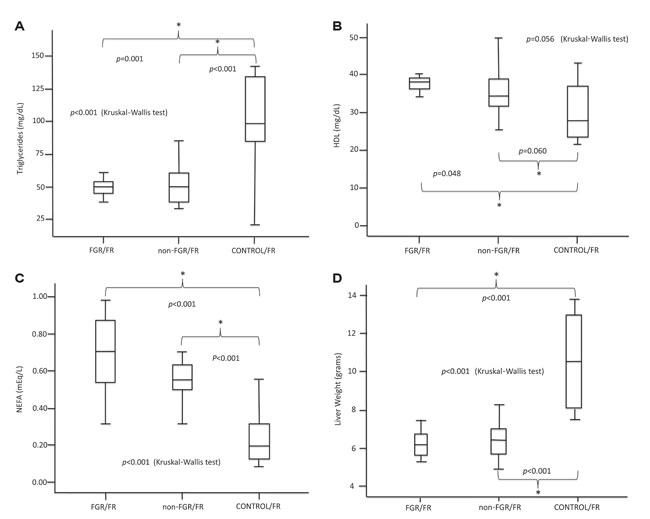
Figure 3. A, B, C, D. Postnatal starvation in prenatally starved animals.
7. Postnatal high-fat diet in prenatally starved animals
The CONTROL/FF group showed increased BW and glucose levels compared to the FGR/FF and non-FGR/FF groups (p=0.007 and p=0.012, respectively) (Figures 4A, 4B). Furthermore, the CONTROL/FF group showed marginal statistical difference in LW compared to FGR/FF (p=0.05).
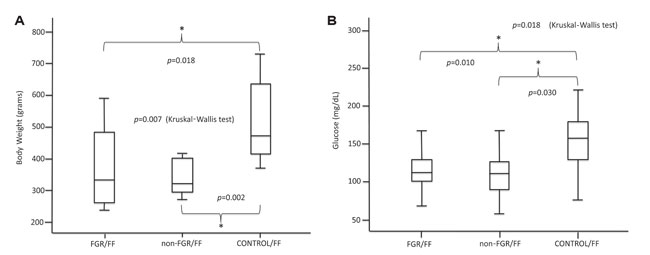
Figure 4. A & B. Postnatal high-fat diet in prenatally starved animals.
DISCUSSION
The findings of this experimental rat model have demonstrated that a combination of specific prenatal and postnatal nutritional statuses produces distinct metabolic profiles in the offspring which may have potential health implications in adult life. Specifically, in the CONTROL pups (representing a model of normal outcome in human infants), BW, LW, glucose, cholesterol, trigycerides and HDL concentrations were shown to be dependent on postnatal diet, with postnatal fat-fed rats being heavier and having greater blood glucose and triglyceride concentrations than those with a postnatally restricted diet. Blood NEFA concentrations were lower in the postnatally food-restricted group.
In the FGR group (representing a model of human infants with IUGR), those with restricted food postnatally had lower body weight, liver weight and triglyceride concentrations compared with animals that received a standard diet and lower glucose concentrations compared to those that received a high-fat diet.
In the non-FGR group (representing a model of human infants having experienced adverse intrauterine conditions but born with mean BW > – 2SD of the mean body weight of the normal population), those with restricted food postnatally showed lower BW and LW compared to rats that received either a standard or high-fat diet and lower triglyceride concentrations compared with animals that received a high-fat diet.
In pups born to fat-fed mothers (representing human infants of obese mothers), restricted postnatal diet significantly reduced BW, LW and cholesterol and triglyceride levels compared to rats that received either a standard or high-fat diet and lower HDL levels compared to animals that received a high-fat diet.
Furthermore, comparing the metabolic profiles of the FGR and non-FGR groups, with the exception of BW and NEFA concentrations in those animals that continued with control diet postnatally, no significant differences were detected in LW, glucose, cholesterol, triglycerides and HDL concentrations, regardless of the postnatal diet (control, restricted or high-fat), suggesting that it is the prenatal environment rather than birthweight per se, combined with postnatal diet, that influences metabolic profiles in adulthood.
It has been suggested22 that mismatch between fetal and postnatal environments could lead to adult disease, thus the manipulation of postnatal diet—by exposing the developing organism postnatally to the same amount of nutrition it was exposed to prenatally—could theoretically prevent adverse metabolic consequences. Since current medical interventions for FGR are mainly focused on the prevention of adverse perinatal complications, whereas postnatal therapeutics for FGR are lacking, it would be essential for IUGR infants to implement lifelong lifestyle interventions (low-fat diet consumption, regular body exercise) aiming at avoiding exposure to conditions of plenty.27 Epidemiological and experimental studies have demonstrated that FGR newborns that exhibit rapid catch-up growth are at increased risk of developing the metabolic syndrome, which however can be improved or even prevented by delaying the rapid catch-up growth phase of the newborn by restricting nutrition.28-30 Similarly, the data from this study demonstrate that the FGR animals continued on restricted nutrition postnatally showed lower levels of triglycerides compared to FGR animals fed a control or high-fat diet. Furthermore, it has been suggested that food restriction improves lipid and glucose metabolism in obese and hypertensive rats.16
In our experimental model, postnatal food restriction was shown to decrease triglyceride levels and increase HDL levels in both the FGR and non-FGR groups at the age of one year compared to animals fed with control diets postnatally, supporting the concept of fetal and neonatal environmental mismatch as a cause of metabolic disease in adult life. Furthermore, no statistically significant difference between the levels of the abovementioned metabolic parameters and LW in both postnatal food restricted FGR and non-FGR animals was observed, suggesting that postnatal prevention and treatment of metabolic syndrome should be administered not only to those with low birthweight, but also to offspring of mothers who experienced adverse events during pregnancy, regardless of birth size.
Additionally, our data have demonstrated that in the control group, NEFA concentrations were significantly lower following a year of food restriction compared to those on a standard diet. Despite the positive association reported between high NEFA levels and impaired pancreatic β-cell function, it has proven difficult to always support a cause-and-effect relationship and to understand how NEFA levels are related to obesity and diabetes.26 In some studies, no clear relationship between NEFAs and the altered β-cell function associated with hyperglycemia has been demonstrated.31,32 In an experimental study, plasma free fatty acid concentrations were significantly lower in food-restricted groups compared with the ad libitum group, presumably reflecting their relative loss of adipose tissue.33 The results of the present study show that there is a trend towards lower NEFA concentrations in the high-fat group compared to the control group. In a previous experimental rat study examining the effects of a high-fat or a high-fructose diet on lipid profiles, the authors found that plasma NEFA concentration decreased in both animal groups compared to controls.34 Additionally, the current data show that in the postnatal food restricted group NEFA concentrations were significantly lower compared to the high-fat group, a finding possibly attributable to adipose tissue loss. Furthermore, postnatal starvation significantly decreased NEFA concentrations of the prenatal control group compared to the FGR and non-FGR groups. There was no statistical difference in NEFA concentrations between the FGR and non-FGR groups. It seems that postnatal food restriction produces the same adipose tissue response in both the FGR and non-FGR groups, suggesting that it is the adverse prenatal event that determines certain metabolic profiles rather than birthweight.
This is the first experimental project in which all nutritional groups and all types of postnatal food manipulation have been studied together in a prospective manner. Unfortunately, due to the number of the studied animals and the duration of the project, unexpected animal losses occurred influencing the male to female ratio in some of the groups, especially the FGR/FR and non-FGR/CONTROL. Nevertheless, the findings of the study conclude that prenatal diet contributes critically to the determination of the metabolic profile of the individual in adulthood, regardless of the birthweight.
Pediatricians could include not only birthweight but also prenatal nutrition per se in the estimation of metabolic risk of infants and children, thus promoting adequate prevention and intervention strategies. Such strategies should include the promotion of breastfeeding and the avoidance of overeating during infancy, not only in small infants but also in normal weight infants born to undernourished mothers, in order to catch up. Furthermore, of utmost importance is the promotion of a healthy lifestyle in adolescent and young adult females who are the pregnant women and mothers of the future.
ACKNOWLEDGMENTS
We would like to express our gratitude and deep appreciation to Katerina A. Marinou, Louise Konaris and Esmeralda Dousi for their expert assistance during the experiments.
We are also most grateful to Graham Burdge for his insightful advice.
FINANCIAL SUPPORT
This work was supported by a grant from The Fetal Medicine Foundation (FMF) (www.fetalmedicine.com), UK.
CONFLICT OF INTEREST
None.
REFERENCES
1. Dudley KJ, Sloboda DM, Connor KL, et al, 2011 Offspring of Mothers Fed a High Fat Diet Display Hepatic Cell Cycle Inhibition and Associated Changes in Gene Expression and DNA Methylation. PLoS One 7: e21662.
2. Weaver IC, Cervoni N, Champagne FA, et al, 2004 Epigenetic programming by maternal behavior. Nat Neurosci 7: 847-854.
3. Lehmann AE, Ennis K, Georgieff MK, et al, 2011 Evidence for a hyporesponsive limbic-hypothalamic-pituitary-adrenal axis following early-life repetitive hypoglycemia in adult male rats. Am J Physiol Regul Integr Comp Physiol 301: R484-490.
4. Alexanderson C, Stener-Victorin E, Kullberg J, et al, 2010 A single early postnatal estradiol injection affects morphology and gene expression of the ovary and parametrial adipose tissue in adult female rats. J Steroid Biochem Mol Biol 122: 82-90.
5. Gottrand F, 2008 Long-chain polyunsaturated fatty acids influence the immune system of infants. J Nutr 138: 1807S-1812S.
6. Nicolaidis S, 2008 Prenatal imprinting of postnatal specific appetites and feeding behavior. Metabolism 57: Suppl 2: 22-26.
7. Lukaszewski MA, Mayeur S, Fajardy I, et al, 2011 Maternal prenatal undernutrition programs adipose tissue gene expression in adult male rat offspring under high-fat diet. Am J Physiol Endocrinol Metab 301: E548-59.
8. Sebert S, Sharkey D, Budge H, et al, 2011 The early programming of metabolic health: is epigenetic setting the missing link? Am J Clin Nutr 94: 1953S-1958S.
9. Lillycrop KA, Burdge GC, 2011 Epigenetic changes in early life and future risk of obesity. Int J Obes (Lond) 2011: 72-83.
10. Pervanidou P, Chrousos GP, 2011 Stress and behavior: the role of nutrients with emphasis on omega-3 fatty acids World Rev Nutr Diet 102: 44-52.
11. Gluckman PD, Hanson MA, 2004 Developmental origins of disease paradigm: a mechanistic and evolutionary perspective. Pediatr Res 56: 311-317.
12. Woodall SM, Breier BH, Johnston BM, et al, 1996 A model of intrauterine growth retardation caused by chronic maternal undernutrition in the rat: effects on the somatotrophic axis and postnatal growth. J Endocrinol 150: 231-242.
13. Vickers MH, Reddy S, Ikenasio BA, Breier BH, 2001 Dysregulation of the adipoinsular axis – a mechanism for the pathogenesis of hyperleptinemia and adipogenic diabetes induced by fetal programming. J Endocrinol 170: 323-332.
14. Franco MDC, Arruda RM, Fortes ZB, et al, 2002 Severe nutritional restriction in pregnant rats aggravates hypertension, altered vascular reactivity, and renal development in spontaneously hypertensive rats offspring. J Cardiovasc Pharmacol 39: 369-377.
15. Franco MDC, Akamine EH, Di Marco GS, et al, 2003 NADPH oxidase and enhanced superoxide generation in intrauterine undernourished rats: involvement of the renin-angiotensin system. Cardiovasc Res 59: 767-775.
16. Takemori K, Kimura T, Shirasaka N, et al, 2011 Food restriction improves glucose and lipid metabolism through Sirt1 expression: a study using a new rat model with obesity and severe hypertension. Life Sci 20: 1088-1094.
17. Galler JR, Tonkiss J, 1991 Prenatal protein malnutrition and maternal behavior in Sprague-Dawley rats. J Nutr 121: 762-769.
18. Langley SC, Browne RF, Jackson AA, 1994 Altered glucose tolerance in rats exposed to maternal low protein diets in utero. Comp Biochem Physiol Physiol 109: 223-229.
19. Woods LL, Ingelfinger JR, Nyengaard JR, et al, 2001 Maternal protein restriction suppresses the newborn renin-angiotensin system and programs adult hypertension in rats. Pediatr Res 49: 460-467.
20. Srinivasan M, Katewa SD, Palaniyappan A, et al, 2006 Maternal high fat diet consumption results in fetal malprogramming predisposing to the onset of metabolic syndrome-like phenotype in their adulthood. Am J Physiol Endocrinol Metab 291: E792-799.
21. Langley-Evans SC, 1996 Intrauterine programming of hypertension in the rat: nutrient interactions. Comp Biochem Physiol A Physiol 114: 327-333.
22. Gluckman PD, Hanson MA, Spencer HG, 2005 Predictive adaptive responses and human evolution. Trends Ecol Evol 20: 527-533.
23. Eleftheriades M, Creatsas G, Nicolaides K, 2006 Fetal growth restriction and postnatal development. Ann N Y Acad Sci 1092: 319-330.
24. Entringer S, Epel ES, Kumsta R, et al, 2011 Stress exposure in intrauterine life is associated with shorter telomere length in young adulthood. Proc Natl Acad Sci U S A 108: E513-518.
25. Pervanidou P, Chrousos GP, 2012 Metabolic consequences of stress during childhood and adolescence. Metabolism 61: 611-619.
26. Weir GC, Laybutt DR, Kaneto H, et al, 2001 Beta-cell adaptation and decompensation during the progression of diabetes. Diabetes 50: Suppl 1: 154-159.
27. Turan OM, Turan S, Gungor S, et al, 2008 Progression of Doppler abnormalities in intrauterine growth restriction. Ultrasound Obstet Gynecol 32: 160-167.
28. Tosh DN, Fu Q, Callaway CW, et al, 2010 Epigenetics of programmed obesity: alteration in IUGR rat hepatic IGF1 mRNA expression and histone structure in rapid vs. delayed postnatal catch-up growth Am J Physiol Gastrointest Liver Physiol 299: G1023-1029.
29. Desai M, Gayle D, Babu J, et al, 2005 Programmed obesity in intrauterine growth-restricted newborns: modulation by newborn nutrition. Am J Physiol Regul Integr Comp Physiol 288: R91-R96.
30. Nobili V, Alisi A, Panera N, et al, 2008 Low birth weight and catch-up-growth associated with metabolic syndrome: a ten year systematic review. Pediatr Endocrinol Rev 6: 241-247.
31. Jonas J C, Sharma A, Hasenkamp W, et al, 1999 Chronic hyperglycemia triggers loss of pancreatic β-cell differentiation in an animal model of diabetes. J Biol Chem 274: 14112-14121.
32. de Souza CJ, Capotorto JV, Cornell-Kennon S, et al, 2000 The beta-cell dysfunction in 48-hour glucose infused rats is not a consequence of elevated plasma lipid or islet triglyceride levels. Metabolism 49: 755-769.
33. Ling PR, Bistrian BR, 2009 Comparison of the effects of food versus protein restriction on selected nutritional and inflammatory markers in rats. Metabolism 58: 835-842.
34. Zaman MQ, Leray V, Le Bloch J, et al, 2011 Lipid profile and insulin sensitivity in rats fed with high-fat or high-fructose diets. Br J Nutr 106: Suppl 1: 206-210.