HORMONES 2013, 12(3): 397–404
DOI: 10.1007/BF03401305
Dimitra Metheniti,1 Sophia Sakka,1 Maria Dracopoulou,1 Alexandra Margeli,2 Ioannis Papassotiriou,2 Christina Kanaka-Gantenbein,1 George P. Chrousos,1 Panagiota Pervanidou1
1Childhood Obesity Clinic, First Department of Pediatrics, University of Athens Medical School, 2Department of Clinical Biochemistry, Aghia Sophia Children’s Hospital, Athens, Greece
Address for correspondence:
Panagiota Pervanidou, MD, 77 Kyprou Str., Papagou, 15669, Athens, Greece, Tel.: 210 6833936, mobile: 6936833936, e-mail: ppervanid@med.uoa.gr; ppervanidou@gmail.com
Received 22-09-2012, Accepted 10-05-2013
Abstract
OBJECTIVE: Hypovitaminosis D has been associated with adult as well as childhood obesity. Retinol-binding-protein-4 (RBP-4) and Neutrophil Gelatinase-associated Lipocalin (NGAL) are altered in obese individuals. The aim of this study was to examine circulating 25-(OH) Vitamin D (25-(OH) D) concentrations according to BMI and its associations with RBP-4 and NGAL in female children and adolescents. DESIGN: Seventy-nine (79) children, aged 8-16 years, were studied and divided into four groups: 19 control (BMI z-score range -2.15 – 1.24), 20 overweight (1.34 – 2.49), 20 obese (2.50 – 2.87) and 20 ultra-obese (3 – 4.37). Patients were derived from a Pediatric Obesity Clinic. Plasma 25-(OH) D, RBP-4 and NGAL concentrations were measured with specific assays. RESULTS: Plasma 25-(OH) D concentrations were decreased significantly in the ultra-obese (p=0.005) and marginally in the obese group (p=0.05) compared to the control group. In the entire BMI range, Spearman correlations revealed strong positive associations between 25-(OH) D and RBP-4 (r=0.349, p=0.002) and between 25-(OH) D and NGAL (r=0.338, p=0.003). CONCLUSIONS: 25-(OH) D is deficient in a clinical population of obese female children and adolescents, whereas in the entire BMI range 25-(OH) D is associated with RBP4 and NGAL concentrations. Longitudinal studies are needed to reveal the role of these associations in metabolic alterations related to childhood and adolescent obesity and associated metabolic morbidities.
Key words: Children, 25-(OH) D, NGAL, Obesity, RBP-4, Vitamin-D
INTRODUCTION
Childhood obesity, which has doubled over the last 20 years and is now an epidemic, is one of the greatest public health challenges of the 21st century.1 Obese children and adolescents, especially those with central adiposity, are more likely to develop glucose intolerance, insulin resistance, dyslipidemia as well as high blood pressure, conditions that comprise the metabolic syndrome. The above comorbidities have been linked to an increased risk for diabetes type 2 and cardiovascular disease in later life.2
Obesity has further been associated with 25-hydroxy Vitamin D [25-(OH) D] deficiency. Serum 25-(OH) D, which is the reflection of the 25-(OH) D status in the body, is low in obese individuals,3,4,5 occasionally with a consequent rise in serum PTH and secondary hyperparathyroidism.6 It has been shown that there is an increased level of 25-(OH) D breakdown in subcutaneous tissues compared to the skin, suggesting decreased bioavailability of 25-(OH) D in such tissues and, therefore, in the circulation of obese individuals.7 An inverse association between 25-(OH) D and body fat is evident in various studies of different populations of obese adults.8,9
25-(OH) D in obese individuals is thought to be stored in body fat compartments resulting in its decreased bioavailability in the serum and its circulatory deficiency.10,11 25-(OH) D stimulates the metabolism of fatty acids and suppresses lipogenesis. Body composition analysis in relation to all areas of adipose tissue—subcutaneous and visceral—demonstrates an independent, negative association between amount of adipose tissue and 25-(OH) D levels.11 Similar results were observed in cohorts of obese children and adolescents in whom the prevalence of low 25-(OH) D increases with age.12 It seems that the western lifestyle, in which outdoor activities have been replaced by sedentary indoor behaviors (such as television and computer games), results in reduced sunlight exposure, which can further decrease 25-(OH) D production, especially among obese adolescents. Seasonal variation, especially winter time, has recently been included as a risk factor for vitamin D deficiency, as highlighted by Tolppanen et al.13
Apart from 25-(OH) D, there is evidence that Retinol Binding Protein-4 (RBP-4)14 and Neutrophil Gelatinase-associated Lipocalin (NGAL),15 which belong to the lipocalin protein family, are associated with insulin resistance16,17 and metabolic syndrome.18 Impaired glucose tolerance states, such as obesity, have been associated with elevated RBP-4 concentrations. We have previously shown that these two proteins have an unexpectedly inverse relation to Body Mass Index (BMI) in young individuals as opposed to adults.19
The aim of the current study was to compare circulating 25-(OH) D concentrations between groups of overweight, obese and ultra-obese children in comparison to a control group of healthy, normal weight children. We have previously presented RBP-4 and NGAL concentrations in the same cohort of children and we used these data also here.19 Furthermore, we aimed to investigate associations between 25-(OH) D with RBP-4 and NGAL concentrations. Since many adipokines (such as adiponectin and leptin) show sexual dimorphism and low concentrations of RBP4, NGAL and 25-(OH) D have been reported mainly in women,20 we decided to examine only female children and adolescents.
PARTICIPANTS AND METHODS
Participants and methods as well as the allocation in groups have been previously described in detail.19 The study was approved by the Ethics Committee of the “Aghia Sophia” Children’s Hospital and was performed according to the Helsinki Declaration.21 Written informed consent was obtained from the participants and their parents. Inclusion criteria were: children and adolescents 8-16 years old, assessed at the Pediatric Obesity Clinic. Exclusion criteria were: 1) underlying chronic illnesses (cardiac, hepatic, renal); 2) chronic use of medications; 3) syndromic obesity; 4) intellectual disabilities or psychiatric disorders; and 5) chromosomal disorders. Children with obesity-related clinical or metabolic alterations were not excluded from the study. The terms “overweight” and “obese” were defined according to the most recent Greek BMI charts14 (BMI = weight in kilograms divided by height squared in meters), which is amended for child and adolescent obesity. BMI z-scores were calculated based on the Greek growth charts.22 All girls underwent a complete physical examination to determine weight, height and BMI, blood pressure and pubertal status (based on Breast Tanner Stage) by a certified pediatrician. Girls in Tanner stage 1 were classified as prepubertal, whereas girls in Tanner stages 2-5 were classified as pubertal.
In this study, a local population of 79 patients, Greek girls aged 8-16, was examined and was stratified in 4 subgroups according to their BMI z-score: a) control group (-2.15-1.24), b) overweight group (1.34 – 2.49), c) obese group (2.50 – 2.87) and d) ultra-obese (3-4.37).
The blood samples for all measurements were collected in the overnight fasting condition during a scheduled morning visit, at 8.00-9.00 a.m., over 1 calendar year. There was no seasonal variation in blood sampling. The blood was centrifuged and the serum obtained was stored at -850C. Fasting glucose and insulin levels were measured with Siemens Advia 1800 Clinical Chemistry System (Siemens Medical Solutions, Tarrytown, NY, USA) and the automated chemiluminescence Siemens ACS180 System (Siemens Medical Solutions, Tarrytown, NY, USA), respectively. The Homeostasis assessment model (HOMA) according to the formula HOMA=Fasting Insulin (mIU/ml) x Fasting glucose (mmol/L)/ 22.5 was used as a marker of insulin resistance. RBP4 was measured with a solid-phase ELISA technique (Immundiagnostik, AG Bensheim, Germany) and NGAL was determined by a solid phase ELISA technique (R&D Systems, Minneapolis, MN, USA). CVs for RBP-4 are 5% and 9.7%, whereas for NGAL 3.1-4.1% and 5.6 to 7.9%, respectively. 25-(OH) D3 was determined using Elecsys 25-OH-D(3) assay (Roche), a direct electrochemiluminescence immunoassay which employs a polyclonal antibody against 25-(OH) D3 using the Roche e411 Cobas immunoassay analyzer (Roche Diagnostics, Mannheim, Germany). CVs for VitD are 5.4-5.7 % and 6.9-9.9 %. Our trust provides internal quality audits. All of the 25-(OH) D samples with minimum value 4ng/ml are tested twice. In general, epidemiological studies in the Greek population have shown low 25-(OH) D concentrations in the entire BMI range.10
STATISTICAL ANALYSIS
Continuous variables are presented as mean ± standard deviation (SD), or median and interquartile range (25th and 75th percentile) in cases of skewed distributions, while categorical variables are presented as percentages. The level of significance was set to ≤0.05. Comparisons of means were performed by Mann-Whitney and Kruskall-Wallis tests. Spearman tests were used for correlations. Log transformation of selected variables was performed, but no additional information was revealed. The effect of age, NGAL, RBP-4 and BMI z-score in relation to 25-(OH) D was examined, using linear regression. The statistical tools used were SAS version 9.2 and SPSS version 18 for Windows 7.
RESULTS
As described previously, participants included female patients aged 8 to 16 years who were divided into 4 subtypes according to their BMI z-score: 20 overweight (BMI z-score 1.34-2.49), 20 obese (2.50-2.87), 20 ultra-obese (also referred to as extremely obese) (>3) and 20 healthy lean matched in age and gender as a control group (<1.24) [Table 1]. Population clinical characteristics and family history are presented in Table 1. Concentrations of 25-(OH) D did not differ between pubertal and prepubertal children. (Kruskal Wallis p value = 0.9).
Statistical analysis showed that the distribution as well as the median of 25-(OH) D is different amongst the four groups. Lower levels of 25-(OH) D were found in the most obese patients of our sample. Figure 1 displays the median 25-(OH) D by BMI category across the four groups. RBP4, NGAL, 25-OH-D and PTH across the four groups are calculated as median (25th – 75th percentile) and are presented in Table 2.
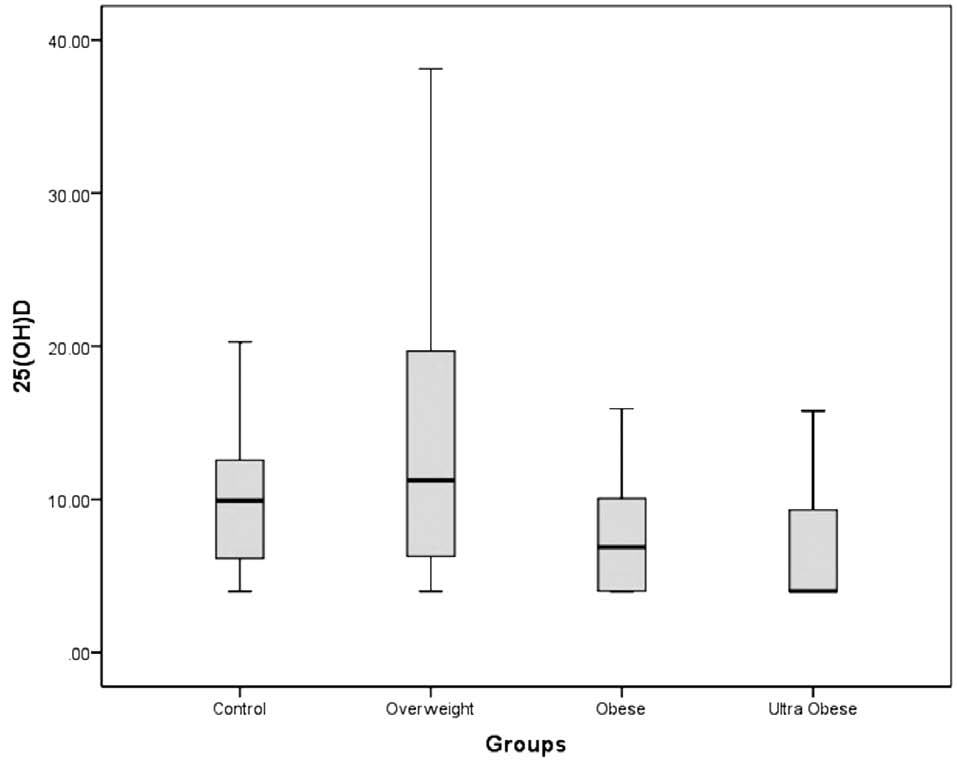
Figure 1. Boxplot of 25-(OH) D (ng/ml) by BMI category.
As indicated in Table 3, fasting glucose concentrations were within the normal range in each group, and similar between groups. Fasting insulin concentrations were significantly higher in the ultra-obese group than in the control group. Similarly, insulin resistance (as reflected by HOMA index) was significantly increased in the obese and the ultra-obese groups compared to the control group.
Our data did not reveal significant correlation between BMI z-score and 25-(OH) D overall. PTH correlated with neither BMI z-score nor 25-(OH) D.
The Kruskal-Wallis test showed that the medians of 25-(OH) D by BMI range are different in the groups examined (p=0.006). The Mann-Whitney U-test for 25-(OH) D demonstrated significant differences between the control and ultra-obese groups (p=0.005). The same holds for the control and obese groups (p=0.05), however, a larger sample is required to provide more evidence, as the level of significance is close to 0.05.
Linear associations between RBP-4 and 25-(OH) D in the entire BMI range as well as between NGAL and 25-(OH) D are explored through Pearson’s correlation coefficient (r=0.277, p=0.015), (r=0.4, p<0.001), respectively. Indeed, Spearman’s correlation showed positive monotonic relations between 25-(OH) D and RBP4 (r=0.349, p=0.002), as well as between 25-(OH) D and NGAL (r=0.338, p=0.003).
The low level of detection for 25-(OH) D is 4 ng/ml. Epidemiological studies in the Greek population have shown low 25-(OH) D concentrations in the entire BMI range.10
Both RBP4 and NGAL are positively correlated with 25-(OH) D. Using linear regression, 25-(OH) D was shown to be positively affected by the two proteins RBP-4 and NGAL and negatively affected by age. NGAL and RBP4 had a strong positive relation with 25-(OH) D, whereas age had a negative one, as depicted in Table 4. The association of 25(ΟΗ) D with BMI z-score was not significant (p-value=0.682).
DISCUSSION
We investigated the impact of BMI elevations on circulating 25-(OH) D and associations of this hormone with RBP-4 and NGAL (previously measured) in female obese children and adolescents. We found that 25-(OH) D was lower in ultra-obese young females than in controls, and that 25-(OH) D concentrations were significantly associated with RBP-4 and NGAL.
There are many adult studies on 25-(OH) D deficiency and its effects, whereas only a few studies have been published conducted in children. In adults, weight loss of about 10% may raise levels of 25-OH-D and this increment seems to correlate with improved insulin resistance.23,24 25-(OH) D deficiency has also been linked to insulin resistance and the metabolic syndrome. Previous studies suggested that the impact of 25-(OH) D deficiency on insulin resistance could not be attributed entirely to obesity.25 Studies of Pacifico et al. demonstrated that adiposity and hypertension were inversely related to low levels of 25-(OH) D.25 In a recent study, Chrousos et al. determined a positive correlation between adiponectin and 25-(OH) D, suggesting that the latter is a potential link between insulin resistance and diabetes mellitus type 2.26 Computed tomography (CT) imaging, which allows reliable characterization of subcutaneous and visceral adipose tissue, suggests that levels of 25-(OH) D may be related to variation in regional adiposity.27 There are many adult studies28 to support the inverse relations between 25-(OH) D and BMI, proposing that 25-(OH) D is stored in large adipose tissue deposits and therefore its bioavailability is reduced.29
There is evidence to support the hypothesis that in obese individuals, an increased volume of distribution of 25-(OH) D is due to its sequestration in hypertrophic adipose tissue.30 As suggested by Olson et al., an increased clearance of 25-(OH) D may be due to increased uptake by adipose tissue,30 which may also promote the production of active metabolite vitamin D of 1,25-(OH) 2D and therefore have a negative effect on hepatic synthesis of 25-(OH) D.31 Mansour et al.32 showed that older children are more prone to develop 25-(OH) D deficiency than younger ones (P=0.000) and that the intake of 25-(OH) D decreases with increasing age, as found also in other studies.33 This is latter view, however, disagrees with the report by McGillivray34showing higher levels of 25-(OH) D deficiency in the younger age group. Recent studies have shown that in obese children low levels 25-(OH) D were associated with increased markers of oxidative stress, inflammation and endothelial activation.35 It has been observed that increased total central adiposity and decreased exercise frequency are directly related to insulin resistance.36 Exercise reduces levels of fasting insulin and improves insulin sensitivity through structural and biochemical changes in skeletal muscle.
Studies of Alemzadeh et al6 have shown that children with 25-(OH) D deficiency had reduced sensitivity to insulin compared to those with adequate levels. There was also a negative correlation between 25-(OH) D and body fat. Reduced levels of vitamin in obese subjects seem to occur because of enhanced binding of 25-(OH) D to peripheral fat.37 25-(OH) D is therefore positively correlated to insulin sensitivity, but negatively correlated to HbA1c, suggesting that obese children are deficient in 25-(OH) D and have a higher risk of developing impaired glucose tolerance and so are predisposed to type 2 diabetes. 38
The main insulin-stimulated glucose transporter GLUT-4 is down-regulated preferably in adipocytes in insulin-resistant states.39 In mouse studies, the genetic knockout of GLUT-4 has been associated with high levels of RBP-4.40 Yang et al. have studied subjects with obesity, type 2 diabetes and subjects without any disease but with a strong family history of the same comorbidities and found that an increase in RBP4 correlates with insulin resistance in all patients, demonstrating that RBP4 could be used as a tool to predict risk factors for cardiovascular disease.41 There are very few and conflicting studies on obese children or adolescents suggesting any type of correlation between BMI and 25-(OH) D, RBP-4 and NGAL. In our study, the incidence of 1st degree relatives with diabetes type 2 was 5% for the control and overweight group, 10% for the obese and 40% for the ultra-obese group. We can therefore argue that ultra-obese patients are more likely to develop diabetes type 2, having lower 25-(OH) D concentrations and higher levels of RBP4 and NGAL.
A linear association between Lipocalin-2 and 25-(OH) D, as well as between Retinol-Binding-Protein-4 and 25-(OH) D, is evident from the results of this study. This means that the latter has an increasing trend as the NGAL and RBP4 levels increase in our female population. Studies of Gavi et al42 show a positive correlation between RBP4, adiposity and an increased inflammatory state, whereas Wang et al43 have reported similar results regarding Lipocalin-2. There are studies, though, that do not support the above,44,45 while similarly, there are no studies showing a direct association of 25-(OH) D, RBP4 and Lipocalin 2 in obese female children and adolescents. We therefore underline the importance of further investigation in this area.
Our study had several limitations. The sample size is relatively small. Since all blood sampling was obtained throughout a calendar year, as a consequence, there was no seasonal variation of the values of vitamin D. Furthermore, this is a cross-sectional study and there are limited confounding factors as well as lack of differentiation between causality and result. Moreover, we have not included patients’ nutrient intake nor their level of physical activity, which would have given a more holistic approach to the subject.
In conclusion, there is increasing prevalence of vitamin D deficiency amongst children and adolescents even in countries with adequate sunlight exposure. Our study aids in the comprehension of pathophysiological mechanisms related to hypovitaminosis D in obese children and adolescents revealing correlations with novel markers of obesity. Further investigation, taking into account broader parameters, is therefore warranted of larger groups of young obese individuals, which could potentially lead to new dietary measures.
GRANT/FUNDING SUPPORT:
Funding was received from Athens University Medical School (to I.P.) and the Leventis Foundation (to G.C.). The funding sources played no role in thestudy design, in the collection, analysis and interpretationof data, in the writing of the report or in the decision tosubmit the report for publication.
FINANCIAL DISCLOSURES:
None declared.
ACKNOWLEDGEMENTS:
Non-applicable.
REFERENCES
1. Stanford Prevention Research Center – http://prevention.stanford.edu
2. Kassi E, Pervanidou P, Kaltsas G, Chrousos G, 2011 Metabolic Syndrome Definitions and Controversies. BMC Medicine, 9:48.
3. Rajakumar K, Fernstrom JD, Holick MF, Janosky JE, Greenspan SL, 2008 Vitamin D Status and Response to Vitamin D3 in Obese vs Non-obese African American Children. Obesity 16: 90-95.
4. Al-Othman A, Al-Musharaf S, Al-Daghri NM, et al, 2012 Effect of physical activity and sun exposure on vitamin D status of Saudi children and adolescents. BMC Pediatr Jul 12: 92.
5. Al-Musharaf S, Al-Othman A, Al-Daghri NM, et al 2012 Vitamin D deficiency and calcium intake in reference to increased body mass index in children and adolescents. Eur J Pediatr 171:1081-1086.
6. Alemzadeh R, Kichler J, Babar G, Calhoun M 2008 Hypovitaminosis D in obese children and adolescents: relationship with adiposity, insulin sensitivity, ethnicity and season. Metabolism 57:183-191.
7. Wortsman J, Matsuoka LY, Chen TC, Lu Z, Holick MF 2010 Decreased bioavailability of vitamin D in obesity. Am J Clin Nutr 72: 690-693.
8. Moshonis G, Tanagra S, Koutsikas K, et al, 2009 Association between serum 25-hydroxyvitamin D levels and body composition in postmenopausal women: the postmenopausal Health Study. Menopause 16: 701-717.
9. Taheri E, Saedisomeolia A, Djalali M, Qorbani M, Civi MM, 2012 The relationship between serum 25-hydroxy vitamin D concentration and obesity in type 2 diabetic patients and healthy subjects. J Diabetes Metab Disord 11:16.
10. Singhellakis PN, Malandrinou F, Psarrou CJ, Danelli AM, Tsalavoutas SD, Constandellou ES, 2011 Vitamin D deficiency in white apparently healthy, free-living adults in a temperate region. Hormones (Athens) 10: 131-143.
11. Zemel MB 2001 Calcium Modulation of Hypertension and Obesity: Mechanisms and Implications. J Am Coll Nutr 20: Suppl 5: 428-435.
12. Cashman KD, 2007 Vitamin D in childhood and adolescence. Postgrad Med J 83: 230-235.
13. Tolppanen AM, Fraser A, Fraser WD, Lawlor DA, 2012 Risk factors for variation in 25-hydroxyvitamin D₃ and D₂ concentrations and vitamin D deficiency in children. J Clin Endocrinol Metab 97: 1202-1210.
14. Pervanidou P, Eleftheriades M, Papassotiriou I 2012 Adipokines and Anthropometry: Childhood and Adolescent Obesity. In Preedy VR (ed), Handbook of Anthropometry: Physical Measures of Human Form in Health and Disease, Springer Science+Business Media, New York; pp, 1221-1236.
15. Yan QW, Yang Q, Mody N, et al, 2007 The Adipokine Lipocalin 2 Is Regulated by Obesity and Promotes Insulin Resistance. Diabetes 56: 2533-2540.
16. Quadro L, Blaner WS, Salchow DJ, et al, 1999 Impaired retinal function and vitamin A availability in mice lacking retinol-binding protein. EMBO J 18: 4633-4644.
17. Rasouli N, Kern PA, 2008 Adipocytokines and the metabolic complications of obesity. J Clin Endocrinol Metab 93:11 Suppl 1: 64-73.
18. Graham TE, Yang Q, Blucher M, et al, 2006 Retinol-Binding Protein 4 and Insulin Resistance. N Engl J Med 354: 2552-2563.
19. Kanaka-Gantenbein C, Margeli A, Pervanidou P, et al, 2008 Retinol-binding protein 4 and lipocalin-2 in childhood and adolescent obesity: when children are not just “small adults”. Clin Chem 547:1176-1182.
20. Chan TF, Tsai YC, Wu CH, Lee CH, Wang SH, Su JH 2011 The positive correlation between cord serum retinol-binding protein 4 concentrations and fetal growth. Gynecol Obstet Invest 72: 98-102.
21. World Medical Association Declaration of Helsinki, Ethical Principles for Medical Research Involving Human Subjects, Bulletin of the World Health Organization, 2001, 79: 373-374.
22. Chiotis D, Tsiftis G, Xatzisimeon M, Maniati M, Krikos X, A Dacou-Voutetakis, 2004 Body mass index and prevalence of obesity in subjects of Hellenic origin aged 0-18 years living in the Athens area Ann Clin Paediatric Univ Atheniensis 51: 139-154.
23. Takiishi T, Gysemans C, Bouillon R, Mathieu C, 2010 Vitamin D and Diabetes. Endocrinol Metab Clin North Am 39: 419-446.
24. Parker J, Hashmi O, Dutton D, et al, 2010 Levels of vitamin D and cardiometabolic disorders: Systematic review and meta-analysis. Maturitas 65: 225-236.
25. Pacifico L, Anania C, Osborn JF, et al, 2011 Low 25(OH)D3 levels are associated with total adiposity, metabolic syndrome, and hypertension in Caucasian children and adolescents. Eur J Endocrinol 165: 603-611.
26. Al-Daghri NM, Al-Attas OS, Alokail MS, et al, 2011 Hypovitaminosis D Associations with Adverse Metabolic Parameters Are Accentuated in Patients with Diabetes Mellitus Type 2: A BMI-Independent Role of Adiponectin? J Endocrinol Invest 36: 1-6.
27. Bischof MG, Heinze G, Vierhapper H, 2006 Vitamin D status and its relation to age and body mass index. Horm Res 66: 211-215.
28. Vilarrasa N, Maravall J, Estepa A, et al, 2007 Low 25-hydroxyvitamin D concentrations in obese women: Their clinical significance and relationship with anthropometric and body composition variables. J Endocrinol Invest 30: 653-658.
29. Buyukinan M, Ozen S, Kokkun S, Saz EU, 2012 The relation of vitamin D deficiency with puberty and insulin resistance in obese children and adolescents. J Pediatr Endocrinol Metab 25: 83-87.
30. Olson ML, Maalouf NM, Oden JD, White PC, Hutchison MR 2012 Vitamin D deficiency in obese children and its relationship to glucose homeostasis J Clin Endocrinol Metab 97: 279-285.
31. Zhou P, Schechter C, Cai Z, Markowitz M, 2011 Determinants of 25(OH)D sufficiency in obese minority children: selecting outcome measures and analytic approaches. J Pediatr 158: 930-934.
32. Mansour NM, Alhadidi KM, 2012 Vitamin D deficiency in children living in Jeddah, Saudi Arabia, Indian J Endocrinol Metab 16: 263-269.
33. Saintonge S, Bang H, Gerber LM, 2009 Implications of a new definition of vitamin D deficiency in a multiracial US adolescent population: The national health and nutrition examination survey III. Pediatrics 123: 797-803.
34. McGillivray G, Skull SA, Davie G, 2007 High prevalence of asymptomatic vitamin D and iron deficiency in East African immigrant children and adolescents living in a temperate climate. Arch Dis Child 92(12): 1088-1093.
35. Codoñer-Franch P, Tavárez-Alonso S, Simó-Jordá R, Laporta-Martín P, Carratalá-Calvo A, Alonso-Iglesias E, 2012 Vitamin D status is linked to biomarkers of oxidative stress, inflammation, and endothelial activation in obese children. J Pediatr 161: 848-854.
36. Cline GW, Petersen KF, Krssak M, et al, 1999 Impaired glucose transport as a cause of decreased insulin-stimulated muscle glycogen synthesis in type 2 diabetes. N Engl J Med 341: 240-246.
37. Krekoukia M, Nassis GP, Psarra G, Skenderi K,
Chrousos GP, Sidossis LS, 2007 Elevated total and central adiposity and low physical activity are associated with insulin resistance in children. Metabolism 56: 206-213.
38. Shepherd PR, Kahn BB, 1999 Glucose transporters and insulin action-implications for insulin resistance and diabetes mellitus. N Engl J Med 1341: 248-257.
39. Apelt J, Mehlhorn G, Schiebs R, 1999 Insulin-sensitive GLUT4 glucose transporters are colocalized with GLUT3-expressing cells and demonstrate a chemically distinct neuron-specific localization in rat brain, J Neurosci Res 57: 693-705.
40. Kos K, Wong S, Tan BK, et al, 2011 Human RBP4 adipose tissue expression is gender specific and influenced by leptin. Clin Endocrinol (Oxf) 74:197-205.
41. Yang Q, Graham TE, Mody N, et al, 2005 Serum retinol binding protein 4 contributes to insulin resistance in obesity and type 2 diabetes. Nature 436: 356-362.
42. Gavi S, et al, 2007 Retinol-binding protein 4 is associated with insulin resistance and body fat distribution in non-obese subjects without type 2 diabetes. J Clin Endocrinol Metab 92: 1886-1890.
43. Wang Y, Lam KS, Kraegen EW, et al, 2007 Lipocalin-2 is an inflammatory marker closely associated with obesity, insulin resistance, and hyperglycemia in humans. Clin Chem 53: 34-41.
44. Promintzer M, Krebs M, Todoric J, et al, 2007 Insulin resistance is unrelated to circulating retinol binding protein and protein C inhibitor. J Clin Endocrinol Metab 92: 4306-4312.
45. Broch M, Vendrell J, Ricart W, Richart C, Fernández-Real JM, 2007 Circulating retinol-binding protein-4, insulin sensitivity, insulin secretion, and insulin disposition index in obese and nonobese subjects. Diabetes Care 30: 1802-1806.