Address correspondence and requests for reprints to:
Prof. G. Krassas, MD, Associate Professor of Medicine, Chairman, Dept. of Endocrinology and Metabolism, “Panagia” General Hospital, N. Plastira 22, N. Krini 55132, Thessaloniki, Greece, Tel.: +30 2310 447444, Fax.: +30 2310 447444 – +30 2310 282476, e-mail: krassas@the.forthnet.gr
Received 29-11-02, Revised 18-12-02, Accepted 28-12-02
Abstract
The aim of this study was to investigate the prevalence of overweight, obesity and body mass index (BMI) distribution in people living in large territories of Greece, Serbia and Turkey. A cross-sectional multi-national epidemiological survey was designed on the basis of self-reported information on height and weight using the formula kg/m2. Overall, 20,329 individuals, aged 20-68 yrs, 8,973 males and 11,356 females, participated in the study. Of these, 4,032 were selected from northern Greece, 10,069 from southwest Turkey and 6,228 from central Serbia. More specifically, participants from northern Greece were recruited from central Macedonia, from Southwest Turkey from the Kayseri region and from central Serbia from the greater Belgrade area. Our results showed that 12.4% of the population studied was obese and 31.3% overweight. The corresponding figures for participants from Greece were 19.9% and 35.4%, from Turkey 12.0% and 30.9% and from Serbia 8.2% and 29.4%, respectively. Overall, male participants had a higher mean BMI than females. However, Greek females were more obese in comparison with males. The opposite was true of the other two countries. Finally, in both males and females mean BMI tended to increase with age up to 50-59 years, and declined slightly thereafter. In conclusion, the overall prevalence of obesity and overweight in the Balkan peninsula does not differ from that reported in other European countries. However, BMI values between different countries of the Balkan peninsula are fairly variable, Greece leading in the prevalence of obesity with Serbia having the lowest prevalence of obesity. The data from this survey underline the need for health intervention aimed at preventing obesity, especially in Greece.
Key words: Prevalence, obesity, overweight, Balkan countries, Greece, Turkey, Serbia
INTRODUCTION
Obesity is a major health problem in Western societies and inflicts a significant burden on the society in terms of mortality1,2, morbidity3 and psychological distress4.
In recent years, the prevalence of obesity and overweight in the adult population has been rising in most developed countries. In the USA it has been shown that between 1976-80 and 1988-94, the age-adjusted prevalence of obesity [Body mass index (BMI) 330.0 kg/m2] increased from 14.5% to 22.5%, while mean BMI also increased from 25.3 to 26.5 kg/m2 5. Similar increases have been reported in several European countries such as the UK6,7, the Netherlands8, Sweden9,10, Germany11, France12 and Spain13.
The direct and indirect costs of obesity are considerable; it has been reported that expenses associated with excess weight represent 7% of the national health care budget in the US, 7% in the Netherlands, 4% in France and 2% in Australia14.
The Balkan peninsula represents a separate geographic area situated in the south-east part of Europe. Populations of Balkan countries share a number of common racial, cultural and socio-economic characteristics. Data concerning the epidemiology of obesity are scarce in these populations and, to the best of our knowledge are completely lacking from the Balkans as a whole.
The purpose of this study was to provide data regarding the prevalence of obesity among adults from large territories of three Balkan countries, i.e. Greece, Turkey and Serbia separately and in total.
SUBJECTS AND METHODS
Overall, 20,329 individuals aged 20-68 yrs, (8,973 males and 11,356 females) participated in this study. Of these, 4,032 were from northern Greece and specifically from central Macedonia 10,069 from southwest Turkey and specifically from Kayseri region and 6,228 from central Serbia from the greater Belgrade area. Obviously, the samples are not representative of the corresponding nations as a whole. Nevertheless they represent large geographical regions at each country. These regions were chosen at random. Central Macedonia has a population of around 1,100,000 inhabitants which represents 1/10 of the entire national population, southwest Turkey has a population of around 5-6,000,000 and represents 1/10 of the population of the whole country and, finally, central Serbia has a population of about 2,500,000 and represents 1/5 of the population of the whole nation. Central Macedonia and central Serbia are urban areas while southwest Turkey has both urban and rural populations. Finally, concerning the socio-economic characteristics of the population in each region compared to the national mean, central Macedonia and central Serbia are well above the national average while southwest Turkey is below or near the national average. Potential participants were contacted by phone by selection of every 5th person in the telephone directory, and, after having the purpose of the study explained to them, were invited to take part. Other selection criterion was the age (no more than 70 or less than 20 yrs). Approximately 10% of the contacted persons did not wish to participate in the study. Participants were asked about their weight and height without clothes and shoes on. The study started at the beginning of 2000 and terminated at the end of the same year.
Body Mass Index (BMI) was calculated on the basis of self-reported information on height and weight using the formula weight (kg)/height (m2). Following the criteria of the International Obesity Task Force (Geneva, 3-5 June 1997) sponsored by the WHO4, we defined overweight as a BMI between 25 and 29.99 kg/m2, obesity as a BMI ≥30 kg/m2 and morbid obesity as a BMI ≥40 kg/m2. As undernourished subjects were very few, they were categorized as normal weight.
In addition, on the basis of their age the participants were divided into five groups: 20-30, 31-40, 41-50, 51-60 and over 60 years.
Statistical analysis:
We established a database so that the accuracy of each parameter could be easily controlled. Consequently, we tested if normal distribution goodness accords with all quantitative variables existing by using the Kolmogorov-Smirnov test. All variables of the study were found to fit normal distribution. Comparisons between overweight and obese Balkan males and females were made using the x2 test, while comparisons among the BMI for the three populations studied were made by one-way ANOVA. x2 test was used to compare the prevalence of obesity and overweight among the three populations studied. SPSS software (v 12.0 for Windows 2000) was used for biostatistical analysis. Results are presented as mean±SD. Statistical significance was defined as p<0.05.
RESULTS
Mean values ± SD for age, weight, height and BMI for the whole population studied as well as separately for each country are presented in Table 1 .
As shown in Figure 1, 2,521 individuals (12.4%) of the whole population studied were obese while 6,363 (31.3%) were overweight. In the total group, the prevalence of obesity and overweight (Figure 2) was higher in males (13.2% and 34.7%, respectively) than in females (11.8% and 28.6%, respectively) (p<0.001).
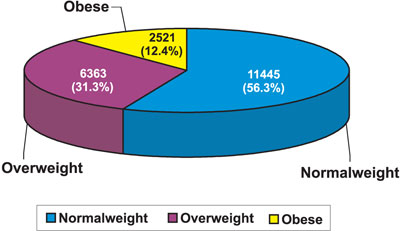
Figure 1. The prevalence of obesity in Balkan countries.
When these data were analyzed separately for each country, we found that the prevalence of obesity and overweight for the Greek population was 19.9% and 35.4%, for the Turkish population 12.0% and 31.0% and for the Serbian population 8.2% and 29.2%, respectively (Table 2 ) (p<0.001). The results according to gender for each country indicated that the prevalence of obesity is higher in Greek females in comparison with males while the opposite is true of the other two countries (Table 2). Concerning overweight, the prevalence was higher in Turkish females while in the other two countries the reverse was true (Table 2), p<0.001.
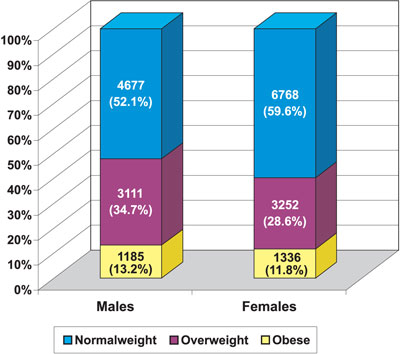
Figure 2. The prevalence of obesity and overweight in the total group, separately for males and females.
The mean BMI for the whole group was 24.9 ±4.5 kg/m2. The mean BMI for the Greek, the Turkish and the Serbian population was 26.2 ±5.0 kg/m2, 24.8±4.4 kg/m2 and 24.1±4.0 kg/m2, respectively. These differences were statistically significant (p<0.001).
The prevalence of obesity and overweight in the different age groups for the whole population is shown in Figure 3.
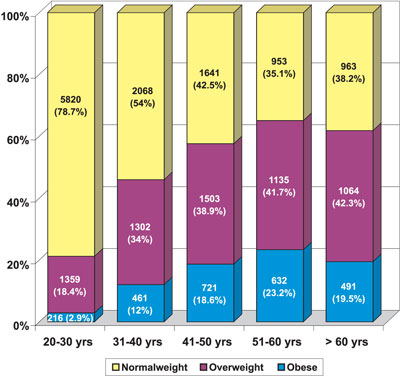
Figure 3. The prevalence of obesity and overweight in the various age groups for the total population studied.
In Figure 4 the prevalence of obesity in Greece, Turkey and Serbia is compared to that of England.
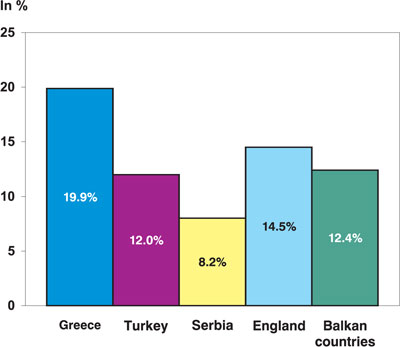
Figure 4. Prevalence of obesity in the studied areas of Greece, Turkey and Serbia compared to England.
DISCUSSION
This study provides important evidence on the prevalence of overweight and obesity in large territories of three countries: Greece, Serbia and Turkey.
We found that the overall prevalence of obesity and overweight in the studied population was 12.4% and 31.3%, respectively. The corresponding figures for the Greek population were 19.9% and 35.4%, for the Turkish 12.0% and 31.0% and for the Serbian 8.2% and 29.2%, respectively.
In a recent pan-European study on 15,239 individuals aged 15 years and over using self-reported data, the prevalence of obesity was about 10% and the prevalence of overweight 36.6% in men and 25.6% in women15. UK subjects had the highest prevalence of obesity (12%) while Italians, French and Swedish subjects had the lowest levels of obesity (about 7%). Greeks had a prevalence of 11%. Also, Greece and the UK showed the highest prevalence of obesity in women. As far as the Greeks are concerned, this study differs from ours in two points. First, the sample was small and second, it most probably concerns the population of the island of Crete, which has different dietary habits from those of the population of northern Greece.
With regards to Turkish populations, a study performed in Istanbul and in which “……… obese were accepted as those with a relative weight of at least 110% of an ideal….” it was found that 42.2% of the studied cases, aged between 31-50, were obese. Of these 86.1% were women and 13.9% were men16. This study differs from ours in two ways; it concerns mainly urban populations and the definition of obesity does not rely on BMI.
Regarding the Serbian population, in one study conducted in the north Backa region of northern Serbia, it was demonstrated that 37% of the individuals studied were obese (BMI between 35-39.8 kg/m2) while 27.4% of the subjects were extremely obese (BMI > 40 kg/m2). A gender difference was also found for the obese individuals. The proportion between normal male: normal female was 36.0 vs 32.3%, while for the obese male: obese female it was 41.3 vs 33.5%. The opposite was true of the extremely obese individuals: male to female ratio was 21.6 vs 32.0%17.
One explanation for the very low prevalence of obesity which we found among Serbs may be that the Serbian population has suffered enormously during the last decade due to wars.
Finally, it has been reported that the prevalence of obesity (BMI ≥30 cm/m2) in Bulgaria for males was 17.6% and for females 23.9% while in Romania it was 20.0% and 12.6%, respectively18.
However, some methodological issues should be considered before we reach final conclusions. First, the samples in our study are not representative of the three nations. They represent certain specific areas of each studied nation. In addition, measures of weight and height were self-reported and not measured by an independent investigator. A consistent observation is that individuals have a tendency to underestimate their weight and to overestimate their height. Alvarez-Torices et al.19, in an efford to evaluate the usefulness of self-reported measures of height and weight, found that the prevalence of obesity based on measured weight and height was 1.8 times that of self-reported values in men and 2.5 times that of self-reported values in women. If they considered only the measured values for those individuals who supplied self-reported heights and weights, these prevalences fall to 1.7 and 1.6 times those of self-reported values, respectively. In another study, Nieto – Garcia et al.20 evaluated the sensitivity and specificity of categorical definitions of body mass defined using self-reported height and weight on 7,455 adult participants on whom both self-reported and measured height and weight were available. Overall, the sensitivity of the obese category when defined with self-reported weight and height was 74% (95% CI = 72% – 76%) and the specificity was 99%. The sensitivity of the categories defined using self-reported measures varied considerably by sex, age and educational level. Overall, the sensitivities were higher for women compared with men as men were less accurate in reporting height. The sensitivity of the categorical definitions of obesity decreased with increasing age and education in both men and women.
Moreover, in a recent study, Niedhammer et al.21 tried to evaluate the validity of self-reported weight and height and the resulting body mass index (BMI) in 7,350 middle-aged subjects, 5,445 men and 1,905 women from the Gazel cohort. They found that weight was significantly underestimated for men (0.54 kg) and for women (0.85 kg) and height overestimated for men (0.38 cm) and women (0.40 cm). These biases led to significant underestimations of BMI (0.29 and 0.44 kg/m2 for men and women, respectively). Consequently, the prevalence of overweight was also underestimated by 13% for men and 17% for women.
It must be mentioned that earlier studies had reached the opposite conclusion i.e. the accuracy of self-reported weight and height is high, based on the high correlation between the self-report and the measured variable22-24.
Finally, another limitation of such a study is the use of a phone book for selection purposes, which may exclude lower socio-economic groups who are less likely to own a telephone, as well as the selection criterion i.e. every 5th person in the telephone directory, which is rather arbitrary.
However, recognizing that our estimates may be lower than what might be found in a survey done by measured height and weight, as well as the limitation of the study by using a phone book, the study provides the only recent data on BMI distribution in a large number of people originating from these three countries.
In conclusion, in this study we found that the overall prevalence of obesity and overweight in large territories of Greece, Serbia and Turkey is 12.4% and 33.3%, respectively. Greeks are the most obese and overweight while Serbs the leanest. Overall, male participants had a higher mean BMI than females. However, Greek females were more obese in comparison to males. Our results indicate that except for Serbia, the prevalence of overweight and obesity is similar to what has been reported for other European countries. The data from this survey stresses the need for health intervention aimed at preventing of obesity, especially in Greece.
ACKNOWLEDGEMENTS
We would like to thank Miss Anna Gialantzi for her excellent secretariat assistance.
This study was awarded the 1st prize for Clinical Investigation at the 4th Panhellenic Medical Congress for Obesity (15-17 February, 2001).
REFERENCES
1. Manson JE, Willett WC, Stampfer MJ, et al, 1995 Body weight and mortality among women. N Engl J Med 333: 677-685.
2. McGinnis JM, Foege WH, 1993 Actual causes of death in the United States. JAMA 270: 2207-2212.
3. Pi-Sunyer FX, 1993 Medical hazards of obesity. Ann Intern Med 119: 655-660.
4. WHO, 1998 Obesity Preventing and Managing. The global epidemic. WHO publ, Geneva.
5. Flegal KM, Troiano RP, 2000 Changes in the distribution of body mass index of adults and children in the US population. Int J Obes Relat Metab Disord 24: 807-818.
6. Department of Health, 1995 The health of the Nation. Fit for the future. Second progress report on the Health of the Nation. London: Department of Health.
7. Prescott-Clark P, Primatesta P, 1998 Health Survey for England 1996 In: Prescott-Clark P, Primatesta P (eds) London:The Stationary Office.
8. Seidell JC, Verschuren WM, Kromhout D, 1995 Prevalence and trends of obesity in The Netherlands 1987-1991. Int J Obes Relat Metab Disord 19: 924-927.
9. Kuskowska-Wolk A, Bergstrom R, 1993a Trends in body mass index and prevalence of obesity in Swedish men 1980-89. J Epidemiol Community Health 47:103-108.
10. Kuskowska-Wolk A, Bergstrom R, 1993b Trends in body mass index and prevalence of obesity in Swedish women 1980-89. J Epidemiol Community Health 47: 195-199.
11. Hoffmeister H, Mensink GB, Stolzenberg H, 1994 National trends in risk factors for cardiovascular disease in Germany. Prev Med 23:197-205.
12. Maillard G, Charles MA, Thibult N, et al, 1999 Trends in the prevalence of obesity in the French adult population between 1980 and 1991. Int J Obes Relat Metab Disord 23: 389-394.
13. Gutierrez-Fisac JL, Banegas Banegas JR, Artalejo FR, Regidor E, 2000 Increasing prevalence of overweight and obesity among Spanish adults, 1987-1997. Int J Obes Relat
Metab Disord 24:1677-1682.
14. Colditz GA, 1999 Economic costs of obesity and inactivity. Med Sci Sports Exerc 31: 663-667.
15. Martinez JA, Kearney JM, Kafatos A, Paquet S, Martinez-Gonzalez MA, 1999 Variables independently associated with self-reported obesity in the European Union. Public Health Nutr 2: 125-133.
16. Yilmaz MT, Arioglu E, Korugan U, Satman I, Buyukdevrim S, Biyal F, 1990 Obesity in Istanbul: results from outpatient clinic records over a period of 10 years. Diabetes Res Clin Pract 10: 49-60.
17. Jakovljevic DJ, Djokic D, Pavlovic M, Zelen B, Sente R, 1999 Zdravstveno stanje stanovnistva, zdravstvne potrebe I koriscenje zdravstvene zastite. Institut za zastitu zdravlja Srbije: `’Dr Milan Jovanovic Batut”, Zavod za zastitu zdravlja, Subotica. (in Serbian)
18. Hainer V, Kunesova M, Parizkova J, Stich V, Slaba S, 1999 Prevalence and causality of obesity in central and eastern Europe In: Guy-Grand B, Ailhaud G (eds) Progress in Obesity Research: 8, 8th International Congress of Obesity, John Libbey & Company Ltd; pp, 673-683.
19. Alvarez-Torices JC, Franch-Nadal J, Alvarez-Guisasola F, Hernandez-Mejia R, Cueto-Espinar A, 1993 Self-reported height and weight and prevalence of obesity. Study in a Spanish population. Int J Obes 17: 663-337.
20. Nieto-Garcia FJ, Bush TL, Keyl PM, 1990 Body mass definitions of obesity: sensitivity and specificity using self-reported weight and height. Epidemiology 1:146-152.
21. Niedhammer I, Bugel I, Bonenfant S, Goldberg M, Leclerc A, 2000 Validity of self-reported weight and height in the French GAZEL cohort. Int J Obes Relat Metab Disord 24: 1111-1118.
22. Palta M, Prineas RJ, Berman R, Hannan P, 1982 Comparison of self-reported and measured height and weight. Am J Epidemiol 115: 223-230.
23. Stunkard AJ, Albaum JM, 1981 The accuracy of self-reported weights. Am J Clin Nutr 34: 1593-1599.
24. Le Marchand L, Yoshizawa CN, Nomura AM, 1988 Validation of body size information on drivers’ licenses. Am J Epidemiol 128: 874-877.