HORMONES 2003, 2(4):201-210
DOI: 10.14310/horm.2002.11101
Address correspondence and requests for reprints to:
Constantin Polychronakos M.D., Montréal Children’s Hospital, 2300 Tupper, suite C244, Montréal, Québec, Canada, H3H 1P3, Tel. 514 412 4400 ext. 22866, e-mail: constantin.polychronakos@mcgill.ca
Received 08-08-03, Revised 22-09-03, Accepted 25-09-03
INTRODUCTION
For the past several decades, the standard diagnostic and clinical research tool in endocrinology has been the hormone assay. The enormous surge in the development and use of molecular and cell biology technologies in the past two decades has advanced our understanding of hormone synthesis, secretion, regulation and action at the cellular level but had a relatively modest impact on the exploration of hormonal physiology and pathology in the intact human subject. This is rapidly changing with the emergence of enlarged and deepened understanding of the molecular underpinnings of endocrine function and the availability of new diagnostic and research technologies. Increasingly, molecular diagnostics is entering the daily practice of endocrinology and endocrine research on human subjects routinely employs molecular genetics methods. With the completion of the sequencing phase of the human genome1, genomic concepts and approaches have added a new dimension whereby the contribution of individual genes to endocrine phenomena is not examined in isolation but rather by looking at the whole complement of genes (or a substantial fraction thereof). This review will attempt to give an overview of these contributions to clinical endocrinology. No distinction will be made between clinical practice and human-subject research, although it will become obvious that some aspects apply more to one than the other.
Mendelian disease (due to disruption of a single gene) will be dealt with first as it accounts for a considerable proportion of endocrine disorders, represents the simplest and best understood instance of the contribution of genetics to endocrinology, and has given rise to routine diagnostics already available to clinicians. Complex disorders, depending on the interaction of environmental factors with a multitude of genetic loci, however, account for the bulk of the morbidity and mortality the endocrinologist has to deal with (obesity, diabetes, hyperlipidemias, autoimmune thyroid disease, most endocrine tumors, most disorders of growth and puberty). The molecular contribution to these disorders is less deterministic and complex and is only now beginning to be elucidated with the use of novel concepts and technologies. Before getting into specifics, a general overview of the human genome and its relationship to function will be given.
THE HUMAN GENOME
The term refers to the entirety of genetic material in a human cell, which is comprised of approximately 3.5 billion nucleotides of chromosomal DNA in the nucleus and the 15 kb of mitochondrial DNA1. Only a small fraction (<2%) encodes protein2. The remainder is found in:
- Introns: sequences interspersed between protein-coding exons and spliced out after transcription of DNA to RNA.
- Sequences encoding the untranslated part of mRNAs, which are involved in mRNA stability3 andin establishing contact with the ribosomes for initiation of translation into protein4.
- Regulatory DNA elements (enhancers, promoters) involved in determining when, in which tissue, how much, and in response to which stimuli the gene will be expressed.
- Structural elements of the chromosome (centromeres and telomeres5, matrix attachment elements6). Each chromosome consists of one long DNA molecule associated with proteins such as histones and transcription factors.
- The majority of DNA sequence is found outside and in-between genes and has no apparent function, as large deletions have no obvious impact on the individual.
The estimated number of human genes is not much more than 30,0007. This is the same number as in the mouse and only 50% more than the worm Caenorabtidis Elegans. Of these genes, more than half are theoretical predictions based on computer analysis of the human genome sequence and have not been studied experimentally8. A large number of genes have been identified as responsible for human disease, including endocrine disease, through DNA mutations that disrupt the function or expression of the protein product. Because the disease is due to disruption of a single gene, its inheritance follows the simple patterns described by Mendel, hence the term Mendelian. An alternative term is monogenic disease.
MONOGENIC ENDOCRINE DISEASES
A significant number of endocrine disorders follow a simple Mendelian pattern in their inheritance and the single gene involved has been identified in most cases (Table 1 ). Before elaborating on the use of gene studies in diagnosis of those disorders, an overview of the methods used to identify them is of interest.
Traditionally two approaches have been used. In the candidate gene approach there is sufficient knowledge of the pathophysiology of the disease to suggest an obvious gene whose protein product is at fault. As an example, the clinical finding of androgen insensitivity (AIS) suggested a problem with the androgen receptor (AR), supported by ligand-binding studies9, and this was eventually confirmed when the gene was cloned throughthe detection of mutations10. The biochemical pathology of the various forms of congenital adrenal hyperplasia (CAH) suggested deficiency of specific adrenal enzymes which were biochemically purified, leading to the cloning of the corresponding gene based on the protein sequence, followed by mutation detection11. LH mutations in testotoxicosis12 mutations in the genes encoding growth hormone13, its receptor (Laron syndrome14) or pituitary transcription factors in certain forms of hypopituitarism15-17 are some other cases where the discovery of the gene involved was guided by known disease pathophysiology.
The development of genome maps over the last 10-15 years18 has permitted an alternative way of identifying disease genes that does not require disease understanding advanced enough to lead to a specific protein. Positional cloning identifies disease genes based not on their function but on their precise position in the genome19. The position is defined by following the co-inheritance (co-segregation) of the phenotypic trait (disease) with polymorphic markers on the DNA within families. The polymorphisms used have no functional significance by themselves but they are used to determine which half of each parental genome an affected child has inherited. If a marker and the disease gene are on a different chromosome, they have a 50% probability of being inherited together. If the marker is very close on the chromosome of the disease gene, they will be almost always inherited together. Values in-between indicate decreasing distance on the chromosome. By statistically combining such observations for a large number of meioses in families of affected individuals, the logarithm-of-odds (LOD) score can be calculated. It represents the base 10 logarithm of the ratio of the likelihood of the observed inheritance pattern if marker and disease locus are close together, over the likelihood of the same pattern if they are not. This procedure may allow localisation of a Mendelian disease to a chromosomal sequence of a million base pairs (Mb) or even less.
Positional identification of a disease-causing locus may sometimes be much more rapidly accomplished if it involves a chromosomal deletion or other form of rearrangement visible on the caryotype. The ability to mark chromosomal regions with DNA probes specific for the known sequence of a chromosomal locus (fluorescent in situ hybridization, or FISH) has extended this to the identification of microdeletions too small to be seen on an ordinary caryotype but too large to be easily detected by molecular means. The Prader-Willi and DiGeorge syndromes were mapped to chromosomes 12 and 22, respectively, on this basis.
Once the disease locus has been mapped, the corresponding sequence is then searched for genes expressed in relevant tissues, and for mutations therein. In this way, multiple endocrine neoplasia type 1 (MEN1) was narrowed down to 2 Mb region on 11q13 where, among 33 genes found there20, menin, a previously unknown gene whose function is still being defined, was detected to be mutated in several different families with MEN121. MEN2 was similarly mapped to a region on 10q11.2, containing the already known RET protoongogene which turned out to be the gene mutated22. Five of the six genes responsible for subtypes of maturity-onset diabetes of the young (MODY) were discovered by similar approaches22. Some of them (glucokinase) were obvious functional candidates while others (hepatocyte nuclear factors) were not.
GENETIC TESTING IN THE DIAGNOSIS OF ENDOCRINE DISEASES
In most monogenic diseases of endocrine interest, the gene involved is known and mutation identification is available. The usefulness of molecular diagnosis in these disorders varies from essential, to confirmatory, to relevant only for research (Table 1 ). In MEN2, for example, preventive thyroidectomy is a life-saving measure against the extremely high risk of medullary thyroid carcinoma23. Molecular identification of mutation carriers for this purpose, prior to any clinical or biochemical signs, has replaced the cumbersome and unreliable pentagastrin stimulation test for calcitonin as an essential part of clinical care. In MEN1, there is no equivalent preventive measure but molecular diagnosis is still helpful in identifying individuals who are not carrying the mutation, to spare them unnecessary screening for the various malignancies. Prediction even without prevention may still be sought by at-risk family members who wish to know, raising a number of ethical and social questions (addressed later in this article). In 21-hydroxylase deficiency, the most common cause of CAH, biochemical diagnosis is rapid, easily available, more reliable and (in cases of partial deficiency) more meaningful for case management than mutation identification, as well as incurring minimal cost. However, if the family opts for prenatal diagnosis and in utero treatment to avoid masculinisation of a female fetus, molecular diagnosis allows earlier (by chorionic villous biopsy rather than amniocentesis) and more reliable identification of affected fetuses24, so that potentially harmful glucocorticoid treatment of the mother can be discontinued as early as possible in the 7 of 8 fetuses that do not need it (4 males and 3 unaffected females). What allows for rapid molecular diagnosis in these cases is that there is a previously affected sibling whose DNA will have already been studied, and the mutation identified. In fact in 21 hydroxylase deficiency, a disease where the clinical/biochemical diagnosis can be made with a high degree of certainty, mutation identification is not even necessary for prediction in siblings. With the availability of high-density single-nucleotide polymorphism (SNP) maps, all one needs is to define the two SNP haplotypes (a haplotype is a series of two or more alleles in loci that are in close proximity to each other) that correspond to the two mutation-carrying parental chromosomes. Even though the SNPs involved are not causative, they are reliable markers, as the probability of recombination over a few kilobases in four meioses is infinitestimally small.
Despite all advances in molecular diagnosis, mutation search in the first affected individual in a pedigree is still a tedious, expensive and time-consuming process for most genetic diseases. Prior to embarking on a thorough search for point mutations, large deletions or insertions that disrupt the architecture of the gene must be ruled out by FISH and Southern blot. Most mutations, however, are point mutations.
A mutation can be anywhere in a gene. The typical length of the mRNA sequence of a gene is 2 kb (some genes are much longer), but it does not occur all in one place in genomic DNA, as short protein-coding exons (hundreds of bp) are interrupted by long introns (several kb or tens of kb). Typically, each exon (a gene may have dozens of exons) must first be amplified by PCR to separate it from the 3.5 billion bp of the rest of the genome, then sequenced. If the gene is expressed in an easily accessible tissue, such as blood cells or fibroblasts, it is sometimes preferable to amplify RNA after reverse transcription (RT-PCR), an approach that avoids the tedious exon-by-exon amplification, as the introns have been spliced out of the RNA. An additional advantage of this approach is that it will detect mutations in introns that might affect splicing by skipping exons or introducing aberrant exons that disrupt the protein sequence. Another type of mutation that may be missed by the conventional approach is a promoter mutation that interferes with expression. These, however, are exceptions, most mutations causing monogenic disease being in the protein-coding sequence.
Sometimes the search for mutations is facilitated by the fact that the same mutation recurs in unrelated families or that mutations cluster in a particular exon. For example, an A-to-G transition that results in a substitution of glycine for aspartate at position 578 (Asp578Gly in standard terminology) in the sixth transmembrane helix of the LH receptor, constitutively activates it and accounts for testotoxicosis in a large proportion of affected, non-related families12. Therefore, an assay targeted to this mutation, or to the surrounding 6th transmembrane helix, would be an efficient first step in screening new families. Similarly, a large proportion of all gain-of-function mutations of glutamate dehydrogenase that cause the dominant form of neonatal hyperinsulinemia25 are found on exons 6 or 7, so it makes sense to start the search there (hot spots).
On the other hand, most monogenic diseases are caused by loss of function rather than gain of function mutations and there are many more different ways of destroying a gene other than enhancing it. In most other diseases, each family has its own private mutation that can be anywhere in the gene. In that case, in the absence of previously examined, affected family members, the only way to detect a new mutation is sequencing of all the exons and, if nothing is found there, promoter regions and introns. This is a laborious and time-consuming approach which can be made more efficient by first screening sequence segments for heteroduplex DNA. For this purpose, denaturing high-performance liquid chromatography (dHPLC) has emerged as the ideal method26. It detects short segments of DNA in a PCR amplification product where the two strands are not entirely complementary to each other but differ by as little as one nucleotide.
Once detected, a mutation may have obvious functional consequences, such as introduction of a stop codon that truncates the protein, or a deletion/insertion whose length is not a multiple of 3 and therefore alters the reading frame, producing from that point on a totally different protein sequence (nonsense mutations). The single most common type of mutation, however, is a base substitution that alters one aminoacid (missense mutation). This may have drastic deleterious consequences on the function of the protein, but it may also be perfectly compatible with normal function. Such disease mutations can be easily distinguished from common polymorphisms by failure to find the same alteration in a large number (50-100) of unrelated normal controls. However, rare polymorphisms may also be quite harmless. Ultimately, confirming that a missense mutation causes a disease can be achieved by finding the same mutation in an unrelated family or by functional studies of the altered protein.
Once the mutation(s) in a family is (are) known, it is a simple matter to devise a diagnostic test to screen family members. PCR-RFLP is the most popular method, if the mutation changes a restriction endonuclease site, so that the PCR fragment corresponding to the mutant has a different length after digestion with that enzyme. If no restriction site is altered, single-nucleotide primer extension with allele-specific oligonucleotides probes can be used, as illustrated in Figure 1.
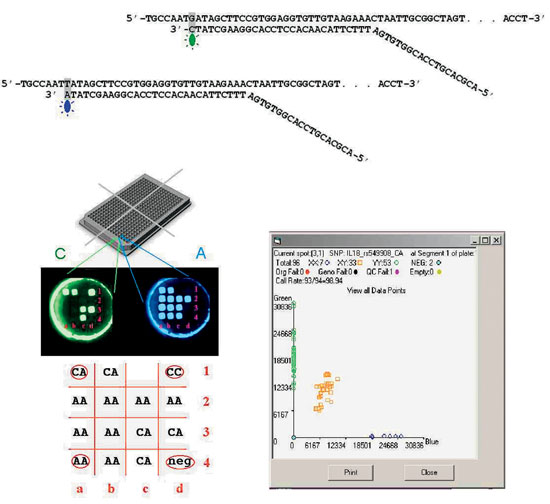
Figure 1. Genotyping twelve G/T polymorphisms in 384 DNA samples simultaneously using the Orchid SNPstream microarray system. Thus up to 4,608 DNA assays can be performed in a single run. (A) Each of the 12 polymorphisms is genotyped by allele-specific extension of a primer probe, with the PCR product serving as a template. The DNA polymerase adds a single nucleotide complementary to the template which can be either an A or a C, each labeled with a different fluorochrome. The 12 different polymorphisms examined together must all involve the same nucleotide substitution. (B) Detection of the incorporation of either or both fluorochromes into the probe is done in a 384 well plate format, containing DNA samples from four 96-well plates. At the bottom of each well there is a 4×4 array of elements, each of which has a “tag” sequence immobilized on its surface. A tag is an arbitrary sequence, the complementary of which is added to the 5′ end of the probe so that the probe corresponding to each of the 12 genes being examined is immobilized on an unique element of the array. The plate is then imaged with filters corresponding to each of the two fluorochromes. Such a picture of one of the 384 wells is illustrated. The individual whose DNA is in the well is heterozygous for those genes where the corresponding element is positive in both photographs, or homozygous if it is only in one. In the vast majority of elements the presence or absence of fluorescence is unequivocal. Computer-assisted calling of the genotypes is done in the 4 x 4 grid. Four of the 16 elements (one in each corner) are used for controls, allowing testing for 12 polymorphisms. Upper left corner (a1) heterozygous control; upper right (d1) C homozygote; lower left (a4) A homozygote, lower right (d4) negative control. Neither fluorochrome hybridized to element c1 (failed test).
GENOME VARIATION AND COMPLEX ENDOCRINE DISEASES
Between any two given individuals approximately 99.9% of the genome sequence is identical. Of the 0.1% that differs (one difference every 1,000 nucleotides on average) most changes are common polymorphisms and most of the polymorphisms are without functional significance. Genetically defined characteristics, including but not limited to predisposition to disease such as obesity, diabetes, hyperlipidemia, autoimmune thyroid disease etc., are determined by variation in a yet unknown but likely small number of genes. Discovering which polymorphisms play this role for specific diseases of endocrine interest has proven to be an immensely more difficult task than discovering monogenic disease mutations but it is even more important, given the much higher incidence of morbidity and mortality attributable to common complex disorders. The concerted international effort towards this goal is just beginning. Diabetes, both type 1 and type 2 (T1D and T2D), will be discussed as the best examples.
The classical linkage approach has been tried in both types of diabetes, mostly in the form of sib-pair analysis, where genotyping for a few hundred markers across the genome is used to detect areas shared by siblings who are both diabetic more often than the expected 50%. In type 1 diabetes, several loci were thus identified, in addition to the known 6p21 locus containing HLA, most of which were not confirmed on testing larger numbers27 and none of which has resulted in the discovery of a susceptibility gene. In T2D, many large studies have achieved so far the identification of a single previously unsuspected candidate. Calpain10, on 2q37.3 encodes a proteolytic enzyme that seems to be related to insulin action10. Above all, these studies have demonstrated the low power of classical linkage to detect complex disease genes conferring a small amount of risk. A much more powerful method examines association of specific alleles by comparing allele frequencies at polymorphisms on relevant genes. The higher power, and the additional advantage that this does not require more than one affected member in the family, comes at a price: the marker must be in close proximity to the disease-causing polymorphism (kilobases or, at most, tens of kb as compared to 10 Mb for sib-pair analysis). This necessitates marker densities three orders of magnitude higher than conventional linkage: depending on the haplotype structure of the human genome, which is just beginning to be defined29, from 100,000 to 1,000,000 markers need to be tested on thousands of individuals, creating the need for potentially billions of assays. Conventional technology obviously is too slow and expensive for this task. Novel, microarray-based technologies, an example of which is given in Figure 1, are being developed for this purpose.
Discovering all (or most) genetic loci predisposing to either type of diabetes has much more than theoretical importance. Although there is currently no effective prevention for T1D, one is actively sought and likely to be available in the not too distant future, likely aided by the insights to be gained from identifying susceptibility genes. This will necessitate identifying individuals at risk who can benefit. Risk prediction on the basis of autoantibodies is an acceptable tool for secondary (after the onset of autoimmunity) prevention in first-degree relatives of T1DM patients. But most diabetics do not have an affected close relative and antibody screening (and re-screening of negatives yearly) is totally impractical in the general population. It is, of course, useless for primary prevention. Genetic screening would overcome both of these serious shortcomings. It is currently not an option as HLA and insulin genotypes alone are insufficient. Sophisticated algorithms taking into account all IDDM loci (no matter how small each individual effect is) will theoretically allow risk prediction close to that derived from being the twin of a diabetic, allowing prevention to focus on ~1% of the population. A panel of DNA genotypes, performed on a drop of blood at birth, will identify those few individuals who should be followed with antibodies or subjected to early primary prevention, as the case may be. One can also envisage a scenario where different preventive approaches may be available and the possibility to choose the one best suited for the individual subject based on genotype. For T2D, effective lifestyle and pharmacological prevention is already available but requires a very substantial effort on the part of the health-care team who can be much better focused if the highest-risk individuals are known before they develop hyperglycemia, when their beta cells may have been irrepairably damaged by gluco- and lipo-toxicity.
EXPRESSION MICROARRAYS (“DNA CHIPS”)
A discussion of modern genetic methods would be incomplete without mention of expression microarrays. An account of the enormous surge in basic cellular and molecular research based on this methodology in the past 3 years is beyond the scope of this review. The technology will be reviewed briefly for its importance in gaining endocrine insights in research involving patients and for its potential clinical applications.
Microarrays examine expression levels of a very large number of genes simultaneously (up to the entire set of 30,000) in an RNA sample, by hybridisation of the sample with an array of specific probes30. A glass slide or silicone chip is divided into a grid, each square of which is covered with different single stranded probe of known sequence. Microarrays are manufactured using robots that can affix nucleic acids to over 50,000 different spots on a 1.5 cm2 area. A computerised sensor detects the presence of fluorescence in each square where the sample is hybridised. Amplified sample RNA with one fluorescent label and reference RNA with another fluorescent label are mixed and incubated with the array. The level of transcription of all genes in a cell or tissue at a single point in time can be assessed by quantitating the amount of fluorescence in each square. Differences in expression can be evaluated at sequential developmental stages, in different cell types, or before and after treatment with a hormone or a drug. Tens of thousands of events can be assessed at once (Figure 2). Thus the “transcriptome” of a particular cell or tissue, in a particular physiologic state, stimulated by a particular hormone can be defined. The cluster of genes that are thus identified to be upregulated or downregulated can be individually assessed for specific roles in the pathway of interest. The most meaningfully informative expression array results come from experiments where the test and reference RNA are identical except for the one factor being studied. Such experiments were used to generate a global picture of the transcriptional response of pancreatic b-cells to glucose31,32 and various target tissues to hormones including leptin33, growth hormone34, thyroid hormone35, and androgens36,37. By examining tissues at various embryonic stages, expression microarrays have been used to evaluate the developmental program of testes38,39. Perhaps one of the most clinically relevant applications is in the diagnosis and prognosis of cancers. Hoos et al. showed that histologically indistinguishable Hurthle cell cancers of the thyroid had heterogeneous microarray expression patterns and the patterns had prognostic value40. Even without knowing the function of these differentially expressed genes, simply observing the pattern can yield useful information that may help target more aggressive therapies at more aggressive tumours.
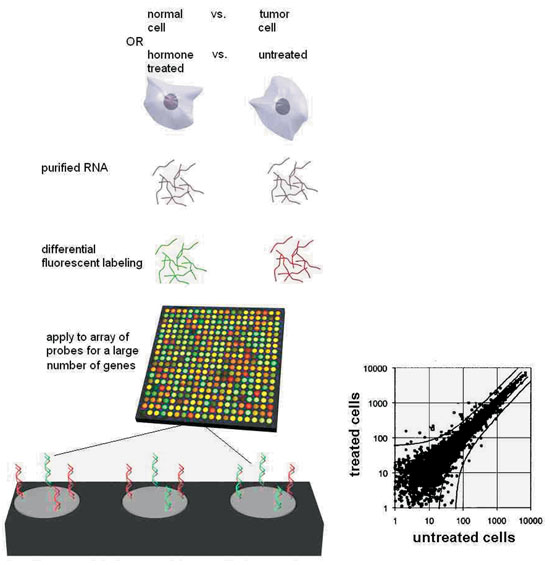
Figure 2. Expression microarrays allow the global evaluation of gene expression of all known genes. In the most informative implementation, they compare RNA from two sources which differ only by the one feature being studied, such as the effect of a hormone in treated vs. untreated cells (or, normal cells from a gland vs. a tumor derived from the gland). RNA from the two sources, each labeled with fluorochromes of different color, is incubated with the microchip. The latter consists of thousands or tens of thousands of microscopic elements on the surface of each of which DNA of a specific sequence, uniquely corresponding to a gene, is immobilised. Labeled RNA from specific genes, expressed in each RNA sample, will quantitatively hybridise to each element. The ratio of the two fluorescence colors reveals whether the hormone (or the malignant state, as the case may be) increases or decreases expression of each gene. The blow-up at the bottom shows three elements, representing: 1. a gene to which mostly red-labeled sample hybridises, i.e. a gene whose expression is increased by the hormone; 2. a gene to which less red than green-labeled sample hybridises, whose expression is therefore deemed to be inhibited by the hormone; and 3. a gene to which both samples hybridise equally, therefore whose expression is unaffected by the hormone. Plotting fluorescent values for the two samples allow statistical evaluation of the experimental variance and detection of differentially expressed genes as outliers.
ETHICAL ISSUES IN GENETIC TESTING
Because of the power and specific nature of molecular as compared to conventional medical diagnostics, genetic testing has been generating issues for which no precedent exists in conventional health-care ethics. The following examples are only a sampling.
- With the steady increase in the power of genetic prediction of late-onset diseases for which no preventive treatment exists, certain questions arise: Should it be offered to those who wish to know anyway? Should parents make such a decision on behalf of their minor children? Should insurers, employers, courts, governments be allowed to make such testing a requirement?
- When genetic testing of an individual will reveal health information relevant to biological relatives of the person being tested, how does this affect our notions of consent, privacy and confidentiality?
- How does a health professional handle genetic testing that was done for diagnostic purposes but reveals non-paternity? Non-maternity? (it has happened!)
- There is strong evidence that many aspects of behavior are genetically determined. What does this do to our conventional notions of free will and moral responsibility? Is the individual exonerated for criminal or other unacceptable acts if he/she carries a specific allele at some behavioral locus?
With a view to addressing these and many other questions, a significant effort has been built into the Human Genome Project under the title Ethical, Legal, and Social Issues (ELSI). Information about its activities can be accessed at: http://www.ornl.gov/hgmis/elsi/elsi.html
REFERENCES
1. International Human Genome Sequencing Consortium, 2001 Initial sequencing and analysis of the human genome. Nature409: 860 – 921.
2. Wolfsberg TG, McEntyre J, Schuler GD, 2001 Guide to the draft human genome. Nature409: 824-826.
3. Decker CJ, Parker R, 1995 Diversity of cytoplasmic functions for the 3′ untranslated region of eukaryotic transcripts. Curr Opin Cell Biol 7: 386-392.
4. Cazzola M, Skoda RC, 2000 Translational pathophysiology: a novel molecular mechanism of human disease. Blood95: 3280-3288.
5. Bloom K, Yeh E, 1989 Centromeres and telomeres: structural elements of eukaryotic chromosomes. Curr Opin Cell Biol 1: 526-532.
6. Glazko GV, Koonin EV, Rogozin IB, Shabalina SA, 2003 A significant fraction of conserved noncoding DNA in human and mouse consists of predicted matrix attachment regions. Trends Genet 19: 119-124.
7. Claverie JM, 2001 Gene number. What if there are only 30,000 human genes? Science 291: 1255-1257.
8. Mathe C, Sagot MF, Schiex T, Rouze P, 2002 Current methods of gene prediction, their strengths and weaknesses. Nucleic Acids Res30: 4103-4117.
9. Kaufman M, Pinsky L, Feder-Hollander R, 1981 Defective up-regulation of the androgen receptor in human androgen insensitivity. Nature 293: 735-737.
10. Sai T, Seino S, Chang C, et al, 1990 An exonic point mutation of the androgen receptor gene in a family with complete androgen insensitivity. Am J Hum Genet 46: 1095-1100.
11. White PC, New MI, Dupont B, 1984 HLA-linked congenital adrenal hyperplasia results from a defective gene encoding a cytochrome P-450 specific for steroid 21-hydroxylation. Proc Nat Acad Sci81: 7505-7509.
12. Laue L, Chan W-Y, Hsueh AJW, et al, 1995 Genetic heterogeneity of constitutively activating mutations of the human luteinizing hormone receptor in familial male-limited precocious puberty. Proc Nat Acad Sci 92: 1906-1910.
13. Phillips JA, Hjelle BL, Seeburg PH, Zachmann M, 1981 Molecular basis for familial isolated growth hormone deficiency. Proc Nat Acad Sci 78: 6372-6375.
14. Amselem S, Duquesnoy P, Attree O, et al, 1989 M. Laron dwarfism and mutations of the growth hormone-receptor gene. New Eng J Med321: 989-995.
15. Radovick S, Nations M, Du Y, Berg LA, Weintraub, BD, Wondisford FE, 1992 A mutation in the POU-homeodomain of Pit-1 responsible for combined pituitary hormone deficiency. Science 257: 1115-1118.
16. Wu W, Cogan JD, Pfaffle RW, et al, 1998 Mutations in PROP1 cause familial combined pituitary hormone deficiency. Nat Genet 18: 147-149.
17. Dattani MT, Martinez-Barbera JP, Thomas PQ, et al, 1998 Mutations in the homeobox gene HESX1/Hesx1 associated with septo-optic dysplasia in human and mouse. Nat Genet 19: 125-133.
18. Buetow KH, Weber JL, Ludwigsen S, et al, 1994 Integrated human genome-wide maps constructed using the CEPH reference panel. Nat Genet 6: 391-393.
19. Collins FS, 1995 Positional cloning moves from perditional to traditional. Nat Genet 9: 347-350.
20. Guru SC, Agarwal SK, Manickam P, et al, 1997 A transcript map for the 2.8-Mb region containing the multiple endocrine neoplasia type 1 locus. Genome Res 7: 725-735.
21. Chandrasekharappa SC, Guru SC, Manickam P, et al, 1997 Positional cloning of the gene or multiple endocrine neoplasia-type 1. Science 276: 404-406.
22. Mulligan LM, Kwok JBJ, Healey CS, et al, 1993 Germ-line mutations of the RET proto-oncogene in multiple endocrine neoplasia type 2A. Nature363: 458-460.
23. Brandi ML, Gagel RF, Angeli A,et al, 2001 Guidelines for diagnosis and therapy of MEN type 1 and type 2. J Clin Endocr Metab 86: 5658-5671.
24. New MI, 1990 Prenatal diagnosis and treatment of adrenogenital syndrome (steroid 21-hydroxylase deficiency). Dev Pharmacol Ther 15: 200-210.
25. Stanley CA, Lieu YK, Hsu BYL, et al, 1998 Hyperinsulinism and hyperammonemia in infants with regulatory mutations of the glutamate dehydrogenase gene. New Eng J Med 338: 1352-1357.
26. O’Donovan MC, Oefner PJ, Roberts SC, et al, 1998 Blind analysis of denaturing high-performance liquid chromatography as a tool for mutation detection. Genomics52 : 44-49.
27. Cox NJ, Wapelhorst B, Morrison VA, et al, 2001 Seven regions of the genome show evidence of linkage to type 1 diabetes in a consensus analysis of 767 multiplex families. Am J Hum Genet 69: 820-830.
28. Horikawa Y, Oda N, Cox NJ, et al, 2000 Genetic variation in the gene encoding calpain-10 is associated with type 2 diabetes mellitus. Nat Genet 26: 163-175.
29. Gabriel SB, Schaffner SF, Nguyen H, et al, 2002 The structure of haplotype blocks in the human genome. Science296: 2225-2229.
30. Slonim DK, 2002 From patterns to pathways: gene expression data analysis comes of age. Nat Genet 32: Suppl: 502-508.
31. Webb GC, Akbar MS, Zhao C, et al, 2000 Expression profiling of pancreatic beta cells: glucose regulation of secretory and metabolic pathway genes. Proc Natl Acad Sci USA 97: 5773-5778.
32. Shalev A, Pise-Masison CA, Radonovich M, et al, 2002 Oligonucleotide microarray analysis of intact human pancreatic islets: identification of glucose-responsive genes and a highly regulated TGFbeta signaling pathway. Endocrinology 143: 3695-3698.
33. Soukas A, Cohen P, Socci ND, Friedman JM, 2000 Leptin-specific patterns of gene expression in white adipose tissue. Genes Dev 14: 963-980.
34. Flores-Morales A, Stahlberg N, Tollet-Egnell P, et al, 2001 Microarray analysis of the in vivo effects of hypophysectomy and growth hormone treatment on gene expression in the rat. Endocrinology 142: 3163-3176.
35. Clement K, Viguerie N, Diehn M, et al, 2002 In vivo regulation of human skeletal muscle gene expression by thyroid hormone. Genome Res 12: 281-291.
36. Nelson PS, Clegg N, Arnold H, et al, 2002 The program of androgen-responsive genes in neoplastic prostate epithelium. Proc Natl Acad Sci U S A 99: 11890-11895.
37. DePrimo SE, Diehn M, Nelson JB, et al, Transcriptional programs activated by exposure of human prostate cancer cells to androgen. Genome Biol 3: RESEARCH0032.
38. Sha J, Zhou Z, Li J, et al, 2002 Identification of testis development and spermatogenesis-related genes in human and mouse testes using cDNA arrays. Mol Hum Reprod 8: 511-517.
39. Ohta S, Fuse H, Tabuchi Y, 2002 DNA microarray analysis of genes involved in the process of differentiation in mouse Leydig cell line TTE1. Arch Androl 48: 203-208.
40. Hoos A, Stojadinovic A, Singh B, et al, 2002 Clinical significance of molecular expression profiles of Hurthle cell tumors of the thyroid gland analyzed via tissue microarrays. Am J Pathol 160: 175-183.