Address correspondence and requests for reprints to:
Dr. George Mastorakos, 3 Neofytou Vamva St, 10674, Athens, Greece, mail: mastorak@mail.kapatel.gr
Received 03-11-02, Revised 20-12-02, Accepted 27-12-02
Abstract
Pheochromocytoma, a neuroendocrine tumor, is often associated with hyperglycemia. To investigate the underlying pathogenetic mechanisms, five patients (3 women and 2 men, aged 49±2.5, mean±SD) with benign adrenal pheochromocytoma were studied with an oral glucose tolerance test (OGTT) and the euglycaemic clamp technique. They were studied preoperatively without taking any medication (stage I), after taking an alpha adrenergic receptor blocking agent (stage II), after taking both an alpha and a beta adrenergic receptor blocking agent (stage III), and after surgical removal of the tumor (stage IV). Before any treatment, fasting blood glucose levels and glucose levels during the OGTT were pathologic in all patients. In all patients, mean glucose levels of the OGTTs performed at the three preoperative stages of the study were significantly higher than those of the OGTT performed postoperatively (ANOVA, á<0.05). Insulin levels during the OGTTs performed preoperatively peaked at 90 min while postoperatively they peaked at 60 min. No statistically significant difference was found among mean insulin levels during the OGTTs performed at all stages of the study. The clamp-based insulin sensitivity index (SI) improved progressively from stage I to IV of the study (ANOVA, α<0.05) (SIs of stages I, II, III, and IV were, respectively, 3.23±0.9 (mean±SE), 3.79±0.7, 4.67±0.3, 6.38±1 (10-4 dl/kg·min per µU/ml)). In conclusion, the pheochromocytoma-associated metabolic alterations of glucose homeostasis improved substantially only after removal of the tumor. The administration of alpha and beta adrenergic receptor blocking agents resulted in a slight but statistically significant improvement in glucose utilization whereas it completely normalized the cardiovascular manifestations of the disease. Thus, it is possible that either the dose of the adrenergic receptor blocking agent needed to control cardiovascular manifestations of pheochromocytoma is different than that needed for glucose metabolism normalization, or that other pheochromocytoma-associated factors may influence directly and/or indirectly carbohydrate homeostasis.
Key words: Pheochromocytoma, insulin resistance, euglycaemic clamp
INTRODUCTION
Catecholamines can exert their effects on carbohydrate metabolism directly, through stimulation of adrenoreceptors and indirectly, mainly through modulation of pancreatic insulin and glucagon release. Both direct and indirect effects result in a prompt rise in plasma glucose. Stimulation of beta adrenoreceptors in the liver leads to a transient increase in glucose production by the liver via enhanced glycogenolysis and gluconeogenesis1. The indirect actions of catecholamines on glucose production _which are quantitatively more important- are exerted via inhibition of insulin secretion by the pancreas (alpha2 stimulation)2.
Another major effect of catecholamines on carbohydrate metabolism is the inhibition of skeletal muscle glucose uptake3. Epinephrine interferes with carbohydrate metabolism primarily by decreasing exogenous glucose uptake rather than by increasing endogenous glucose production4. Studies in humans have shown that while epinephrine stimulates hepatic glucose output and inhibits glucose uptake, noreprinephrine stimulates transiently glucose output and has no effect on glucose uptake5.
The mechanisms underlying the catecholamine_induced glucose intolerance have not, however, been fully investigated in pheochromocytoma. In an effort to elucidate the mechanisms via which pheochromocytoma-associated hypercatecholaminemia affects carbohydrate metabolism, we examined glucose tolerance in five patients with pheochromocytoma, preoperatively without and with pharmacological beta and/or alpha adrenergic receptor blockade, as well as after surgical removal of the tumor.
PATIENTS AND METHODS
Patients
Five patients (3 women and 2 men, aged 49±2,5, mean±SD) with pheochromocytoma were studied before and after medical and surgical treatment. Pheochromocytoma was suspected on the basis of clinical signs and symptoms and confirmed by elevated plasma catecholamines, urinary metanephrine and VMA levels (Table 1 ) as well as by imaging studies (computerized tomography and [131I] meta-iodo-benzyl-guanidine -MIBG- scan).
Protocol
The patients were studied while hospitalized. The study protocol comprised three preoperative stages and one postoperative. At each stage, an oral glucose tolerance test (OGTT) and a euglycaemic clamp study were performed with a three-day interval. Hypertensive crises when occurring (systolic and diastolic blood pressure exceeding 170 and 95 mmHg, respectively) were treated with nifedipine, a calcium channel blocker (Bayer, Greece). All patients were informed and gave their consent for the study.
Preoperatively:
Stage 1:Patients were studied before receiving any medication.
Stage 2:Patients were studied following a four-week treatment with an alpha-adrenergic receptor blocking agent (10 mg phenoxybenzamine t.i.d.). Alpha-adrenergic receptor blockade was confirmed clinically by postural hypotension and cardiac rate >90 pulses/min.
Stage 3:Patients were studied following an additonal two-week treatment with both an alpha and a beta adrenergic receptor blocking agent (respectively, 10 mg phenoxybenzamine t.i.d. and propanolol 10-40 mg t.i.d.).
Postoperatively:
Stage 4:Patients were studied three months after surgical removal of the tumor.
Methods
Oral glucose tolerance test (OGTT):After a 10-h overnight fast, a Teflon cannula was inserted in an antecubital vein under local anesthesia with lignocain 1%, connected with a 3-way catheter (Abbott-Hellas, Athens, Greece) and kept patent by intermittent infusion with saline 0.9%. The patients sat quietly for 30 min; then the first two blood samples were drawn at 7:30 and at 8:00 am. 75g glucose were subsequently administered per os, and blood sampling followed at 30-min intervals until 10:00 am.
Insulin clamp studies:Tissue sensitivity to insulin was determined by the euglycaemic clamp technique as previously described6. An iv catheter was inserted retrogradely into a dorsal vein on the left arm kept warm via a heated blanket for intermittent sampling of arterialized venous blood. A second catheter was inserted into an antecubital vein in the controlateral arm for administration of glucose and insulin infusions. After collection of three baseline blood samples over 30 min, a primed continuous infusion of crystalline human insulin (NOVO NORDISC HELLAS Ltd., Athens, Greece) was started at a constant rate (40 mU/m2 body surface area/min) via an infusion pump for 180 min to increase plasma insulin levels to approximately 574.4 ìmol/l while maintaining plasma glucose at the basal level (4.44-4.94 mmol/l) by sampling every 5 min. Plasma glucose was clamped at this level by periodically adjusting a variable infusion of a 35% dextrose via an Abbott Lifecare infusion pump (Abbott Laboratories, Inc., Chicago, IL). Insulin levels were measured in blood samples withdrawn at 20 min intervals.
Hormone assays
At each sampling time-point, 10 ml free-flowing blood was withdrawn after discarding the first 2ml, in lithium-heparin tubes and centrifuged immediately at 4oC. Plasma was immediately refrigerated at -70oC for assay of catecholamines and -20oC for assay of insulin. Blood glucose was assayed immediately.
Calculations
Clamp-based index of insulin sensitivity (SI): The steady-state period of the insulin clamp was defined as the final 30-min period (i.e. 150-180 min) during which the coefficient of variation for blood glucose, plasma insulin and glucose infusion rate (GIR) was less than 7% and the correlation of each variable with time was not significant. Mean value was defined as the GIR corrected for the glucose added or removed from the glucose space (space correction) as previously described7. The glucose clamp-derived index of insulin sensitivity (SIclamp) was calculated as follows: SIclamp = GIRss/Gss·ΔΙ ss, where GIRss is the steady-state glucose infusion rate (mg/kg per min), Gss is the steady-state blood glucose concentration (mg/dl) and ÄÉss is the difference between steady-state and basal insulin concentration (µU/ml)8.
Statistical analysis
To compare SI mean values as well as glucose and insulin mean values during OGTT among the four different stages of the study, the ANOVA method was employed. In order to apply the ANOVA method, normality of data was examined by quantile quantile plots, histograms, boxplots and Jarque-bera statistic which revealed that the distribution of the recorded data at each of the four stages of the study approximated the normal. Subsequently, ANOVA tables were applied and the t and f tests regarding comparisons of means between all possible pairs of glucose and insulin and among mean values of SI at each of the four stages of the study were calculated. The level of significance á was set at 0.05.
RESULTS
Glucose response during OGTT (Figure 1)
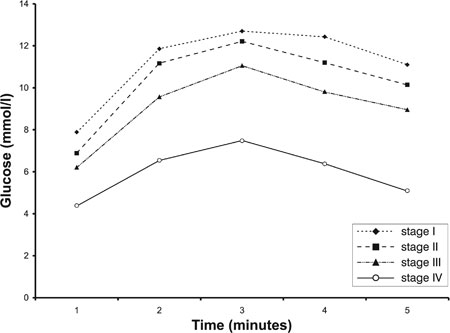
Figure 1. Mean glucose levels at 0, 30, 60, 90 and 120 minutes of the OGTTs performed in the four stages (I, II, III, IV) of the study (see also Table 2).
Before treatment, fasting blood glucose levels and OGTT were pathologic in all patients.Mean glucose levels of the OGTTs performed in all three preoperative stages of the study were significantly higher than those of the OGTT performed postoperatively in all patients (ANOVA, α<0.05) (Table 2 ). In addition, mean glucose levels of the OGTT performed preoperatively without any medication were significantly higher than those post alpha and beta blockade (ANOVA, α<0.05). Mean glucose levels of the OGTT post alpha blockade did not differ from those post alpha and beta blockade (ANOVA, α>0.05).
Insulin response during OGTT (Figure 2)
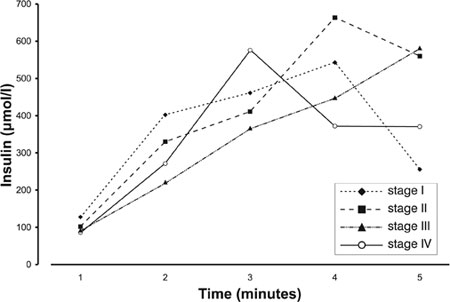
Figure 2. Mean insulin levels at 0, 30, 60, 90 and 120 minutes of the OGTTs performed in the four stages (I, II, III, IV) of the study (see also Table 3).
Insulin levels during the OGTTs performed preoperatively peaked at 90 min while postoperatively they peaked at 60 min.No statistically significant difference was found among mean insulin levels of the OGTTs performed at all stages of the study (Table 3 ).
Euglycaemic clamp studies
Tissue sensitivity to insulin action as assessed by the euglycaemic clamp technique improved after each stage. The mean of the clamp-based insulin sensitivity index (SI) improved progressively in a statistically significant manner from stage I to stage IV of the study (ANOVA, α=0.05)
(Table 4 ) (Figure 3).
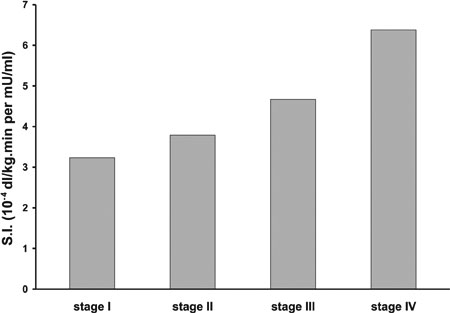
Figure 3. Mean clamp-based indexes of insulin sensitivity (SI) in the four stages of the study. Mean SI improved progressively from stage I to IV of the study in a statistically significant manner from stage to stage (ANOVA, α<0.05) (see also Table 4).
Cardiovascular effects
The administration of alpha and beta adrenergic receptor blocking agents resulted in complete normalization of the cardiovascular manifestations of the disease.
DISCUSSION
Catecholamines play an important role in carbohydrate metabolism. Their hyperglycaemic actions are exerted directly on the liver (transient increase of glucose output via beta receptor stimulation), and indirectly (inhibition of insulin secretion by the pancreas, via alpha receptor stimulation)9,10. Nevertheless, their main effect is inhibitory on glucose uptake by the muscles.
We found that mean glucose levels during OGTT were abnormally increased before any medical treatment and they did not improve preoperatively after four weeks of treatment with an alpha blocking agent. However, the later addition of a beta blocking agent resulted in a statistical improvement of the mean glucose levels of OGTT. After surgical removal of the tumor, normalization of mean glucose levels of OGTT was achieved. Treatment by an alpha with and without a beta blocking agent as well as surgical removal of the tumor did not result in a statistically significat change of mean insulin levels during OGTT. However, the secretory pattern of insulin secretion during OGTT changed after surgery since its peak showed a tendency to move from the 90th minute preoperatively to the 60th minute postoperatively. The lack of insulin modification after treatment with an alpha blocking agent has also been reported by others11.
The euglycaemic clamp technique demonstrated a slight but statistically significant improvement of tissue sensitivity to insulin action post alpha blockade. Interestingly, studies using the same technique have shown that alpha blockade alone is not sufficient to prevent the hyperglycaemic effect of epinephrine infusion in normal man12. It has been reported that the inhibitory effect of epinephrine on glucose uptake may be reversed by the beta adrenergic receptor blocking agent propanolol13. In our study, after the addition of a beta adrenergic receptor blocking agent, insulin sensitivity improved but euglycaemia was not achieved. In contrast, alpha- and beta-mediated cardiovascular effects (hypertension, tachycardia) normalized. This may indicate that the sensitiviy of adrenoreceptors to stimulatory and/or inhibitory agents varies in different tissues. It has been shown that the adrenoreceptors in different tissues are not activated by the same level of catecholamines. In fact, the plasma adrenaline threshold for eliciting cardiovascular effects is different than that eliciting metabolic effects12,14,15. Therefore, the therapeutic result may depend on the dose and/or the threshold of efficiency of alpha and/or beta blocking agents or on the type of secreted catecholamines. The best score for insulin sensitivity was
achieved only after surgical removal of the tumor.
The effects of other tumor-secreted peptides on carbohydrate metabolism should also be considered16 as an explanation for normalization of glucose homeostasis only after tumor removal. Adrenal medulla, besides catecholamines, secretes a series of peptides such as vasoactive intestinal peptide (VIP), substance P, parathyroid hormone (PTH), PTH related peptide, enkephalins, endorphins, interleukin-6, insulin-like growth factor 2, chromogranin A, calcitonin, calcitonin gene related peptide, corticotropin releasing hormone, atrial natriuretic peptide (ANP) and neuropeptide Y. Certain symptoms caused by these peptides, such as pyrexia (II6), polyuria (ANP) and flushing (VIP), cannot be blocked by alpha and beta adrenergic receptor blocking agents. Some of these peptides may have antagonistic effects on insulin action, e.g. VIP has a strong homology to glucagon and stimulates lipolysis and glycogenolysis. Dopamine is co-secreted with catecholamines and is rarely the only product of a pheochromocytoma. Dopamine exerts an inhibitory effect on insulin release but it was not measured in our patients. The fact, however, that all tumors showed a positive MIBG scan and all patients were hypertensive argues against the exclusive secretion of dopamine.
In conclusion, the euglycaemic clamp technique revealed that the use of adrenergic blocking agents improves insulin resistance to a certain degree but does not restore the metabolic hyperglycaemic impact of pheochromocytoma. An optimal score for insulin sensitivity is achieved only by the surgical removal of the tumor.
REFERENCES
1. Bearn AG, Billing B, Sherlock S, 1951 The effect of adrenaline and noradrenaline on hepatic blood flow and splanchnic carbohydrate metabolism in man. J Physiol 115: 430-441.
2. Clutter WE, Rizza RA, Gerich JE, Cryer PE, 1988 Regulation of glucose metabolism by sympathochromaffin catecholamines. Diabetes Metab Rev 4: 1-15.
3. Sacca L, Vigorito C, Cicala M, Ungaro B, Sherwin RS, 1982 Mechanisms of epinephrine-induced glucose intolerance in normal humans. J Clin Invest 69: 284-293.
4. Clutter WE, Bier DM, Shah SD, Cryer PE, 1980 Epinephrine plasma metabolic clearance rates and physiological thresholds for metabolic and hemodynamic actions in man. J Clin Invest 66: 94-101.
5. Sacca L, Morrone G, Cicala M, Corso G, Ungaro B, 1980 Influence of epinephrine, norepinephrine and isoproterenol on glucose homeostasis in normal man. J Clin Endocrinol Metab 50: 680-684.
6. Diamanti-Kandarakis E, Spina G, Kouli C, Migdalis I, 2001 Increased endothelin-1 levels in women with polycystic ovary syndrome and the beneficial effect of metformin therapy. J Clin Endocrinol Metab 86: 4666-4673.
7. De Fronzo RA, Tobin JD, Andres R, 1979 Glucose clamp technique: a method for quantifying insulin secretion and resistance. Am J Physiol 6: 214-223.
8. Bergman RN, Finegood DT, Ader M, 1985 Assessment of insulin sensitivity in vivo. Endocr Rev 6: 45-86.
9. Wilber JF, Turtle JR, Crane NA, 1966 Inhibition of insulin secretion by a phaeochromocytoma. Lancet p, 733.
10. Vance JE, Buchanan KD, O’Hara D, Williams RH, Porte Jr D, 1969 Insulin and glucagon responses in subjects with phaeochromocytoma: effect of alpha adrenergic blockade. J Clin Endocrinol Metab 29: 911-916.
11. Krentz AJ, Hale PJ, Horrocks KEH, et al, 1991 Metabolic effects of pharmacological adrenergic blockade in phaechromocytoma. Clin Endocrinol 34: 139-145.
12. Deibert DC, DeFronzo RA, 1980 Epinephrine-induced insulin resistance in man. J Clin Invest 65: 717-721.
13. Deibert D, DeFronzo RA, 1979 Epinephrine(E)-induced insulin (I) resistance in man. Clin Res 27: 365.
14. Sjostrom L, Schutz Y, Gudinchet F, Hegnell L, Pitter PhG, Jequier E, 1983 Epinephrine sensitivity with respect to metabolic rate and other variables in women. Am J Physiol 245: 431-442.
15. Fellows IW, Bennett T, Macdonald IA, 1985 The effect of adrenaline upon cardiovascular and metabolic functions in man. Clin Sci 69: 215-222.
16. Landsberg L, Young JB, 1985 The influence of diet on the sympathetic nervous system. Neuroendocrine Perspectives 4: 191-218.