Abstract
OBJECTIVE: The present study evaluates adiponectin mRNA in visceral adipose tissue (VAT) and subcutaneous adipose tissue (SAT) and also evaluates its association with metabolic risk factors in postmenopausal obese women. DESIGN: A case control study was carried out on postmenopausal women (n=68), in which 34 were obese and 34 were non-obese. Blood sample, visceral and subcutaneous adipose tissues were obtained. Adiponectin mRNA levels were measured by Real Time-RT PCR. RESULTS: The mean (± SEM) serum adiponectin (28.39 ± 2.52 vs. 20.56 ± 1.13), VAT (0.362 ± 0.098 vs. 0.048 ± 0.005) and SAT (0.222 ± 0.035 vs. 0.042 ± 0.007) adiponectin mRNA levels were significantly lower (p<0.001) in obese than non-obese. However, the mean VAT and SAT adiponectin mRNA levels were similar (p>0.05) between the groups. Further, the mean glucose and TG levels were significantly (p<0.01 or p<0.001) higher, while HDL was lower (p<0.01) in obese than non-obese. Furthermore, VAT adiponectin mRNA also showed significant (p<0.05) and inverse association with TG, while direct association with HDL and both the associations were independent of BMI and WC (waist circumference). CONCLUSION: The BMI and WC independent and significant association of VAT adiponectin mRNA with TG and HDL suggest its potential modulatory role in lipid metabolism in postmenopausal obese women.
INTRODUCTION
Obesity is closely associated with a group of pathophysiologic consequences, including insulin resistance (IR), type II diabetes mellitus (T2D), hypertension, hyperlipidemia and atherosclerosis. The association of obesity with T2D has been well established and the main basis for this link is the ability of obesity to engender IR.1 Circulating free fatty acids (FFAs) derived from adipocytes are elevated in many insulin-resistant states and have been suggested as being a major underlying mechanism of IR in obesity-associated T2D.2,3 However, evidence demonstrates that several adipocyte-derived cytokines or hormones are also involved in obesity-induced IR.
Adiponectin is one of the most extensively studied adipocytokines secreted from adipose tissue along with many “fat hormones”, recently termed “adipocytokines” or “adipokines,” which regulate normal physiology, including energy homeostasis.4,5 In human studies, the plasma concentration of adiponectin was found to be decreased in conditions associated with the metabolic syndrome (MetS).6 Further, plasma concentration of adiponectin was also found to be lower in overweight and obese subjects,7-9 T2D patients10,11 and dyslipidemia sufferers.8,12 It is additionally well documented that accumulation of visceral adipose tissue (VAT) is associated with a higher risk for development of obesity related diseases such as T2D, cardiovascular disease, hypertension and hyperlipidemia.13,14 The VAT compartment may thus be a pathogenic fat depot15-17 which secretes adipocytokines and other vasoactive substances that can influence the risk of developing metabolic traits.17-23
Furthermore, VAT has greater lipolytic activity than subcutaneous adipose tissue (SAT) from which region fatty acids are directly delivered to the liver via the portal vein. Thus, increasing the delivery of lipids to the liver and worsening insulin resistance in the liver promotes triglyceride synthesis which may exacerbate the dyslipidemia. Previous studies found a significant link between visceral adipose tissue and dyslipidemia in patients with T2D.24 Visceral and subcutaneous adipocytes have different capacities to produce hormones and enzymes. In human studies, conflicting results25-27 have been recorded regarding depot-related variation in mRNA expressions of adipokines, including leptin, TNF-α, angiotensinogen, PAI-1. One study found significantly lower SAT adiponectin mRNA levels in 22 healthy first degree relatives of T2D patients as compared to 13 control subjects.28 Moreover, Bjorntrop29 demonstrated that VAT and SAT release unequal amounts of FFA and proteins.30 In contrast to other adipokines, adiponectin is under-expressed in obese patients with insulin resistance or T2D.31 In an animal study, expression of adiponectin in visceral adipose tissue was found higher than subcutaneous.32
Several studies in the literature reviewed suggest that the depot-specific expression of adiponectin at the mRNA level could be relevant to insulin sensitivity, glucose and lipid metabolism and body weight control.
The present study investigates VAT and SAT adiponectin mRNA levels and their association with metabolic risk factors in postmenopausal obese women.
Subjects and methods
A total of 113 postmenopausal female subjects were enrolled during January to August, 2011, at the C.S.M. Medical University, Lucknow, India, who underwent elective abdominal surgery for gall bladder stone or hysterectomy. Of the total, 90 subjects, who gave their written consent, were enrolled for the study. Among these, 34 women (45-70 yrs) were obese (BMI >25 kg/m2, according to the WHO’s guideline for Asians33) and 56 were non-obese. From the 56 non-obese, 34 age-matched subjects unrelated to the obese were selected and considered as control. Thus, a total of 68 post-menopausal women (obese=34 and non-obese=34) were recruited for the study. Tissue samples from abdominal VAT (omental) and SAT were obtained. The tissue samples were stored in RNAlatar (Sigma-Aldrich) for RNA extraction. To rule out the effect of hormone or diet on fat deposition, no specific standard diet/hormonal therapy was given to the patients. In addition to BMI (body mass index), the age and WC (waist circumference) of all recruited subjects were also noted. The study design was approved by the Institutional ethics committee.
Biochemical estimation
Blood samples were taken the next morning after admission to the hospital for surgery. Plasma insulin concentrations were determined using immune radiometric assay (IRMA) (Immunotech). Plasma glucose and lipid profile (Merck kit) concentrations (TG: triglyceride, TC: total cholesterol and HDL: high density lipoprotein) were determined using a semi automated analyzer (Microlab 300, Merck). Serum adiponectin level was measured by enzyme-linked immunosorbent assay (Quantikine Human Adiponectin Cat. No. DRP300, R&D system Inc., Oxford, UK).
Isolation of RNA
Total RNA was isolated using Tri-Reagent (Sigma Chemical Co., St. Louis, MO). RNA was quantified by measuring absorbency at 260 and 280 nm. The integrity of the RNA was checked by visual inspection of the two ribosomal RNAs 18S and 28S on agarose gel.
Real-time PCR measurement of adiponectin mRNA
The adiponectin mRNA levels were estimated by one-step RT-PCR using QuantiTect SYBR Green RT-PCR master mix kit (Qiagen). In Light Cycler 480 (Roche, Real-time thermal cycler), preparation of the reaction components was done in 96 well PCR plate using real-time cycler conditions of 50°C, 30 min (reverse transcription) 95°C, 15 min (initial denaturation) followed by 40 cycles of 94°C, 15 sec, 59°C, 30 sec and 72°C, 30 sec for denaturation, annealing, extension steps, respectively. Primer sequence of human adiponectin was 5’- GTGATGGCAGAGATGGCAC-3’ (5’-3’sequence forward) and 5’-GCCTTGTCCTTCTTGAAGAG-3’ (5’-3’ sequence reverse). Primer sequence of β-actin as internal control (housekeeping gene) was 5’- GTGGCATCCACGAAACTACCTT-3’ (5’-3’sequence forward) and 5’- GGACTCCTGATACTCCTGCTTG-3’ (5’-3’sequence reverse). The PCR primers were synthesized by Agile Lifescience Technologies, India. According to the LCS480 (LightCycler software 480) 1.2.0.169, the data are produced as sigmoid shaped amplification plots in which the number of cycles is plotted against fluorescence. The Threshold Cycle (CT) serves as a tool for calculation of the starting template amount in each sample.
Calculation:
Insulin sensitivity
Homeostasis model assessment (HOMA), an index of insulin sensitivity, was calculated as described elsewhere34 [HOMA= fasting insulin (μU/mL) x fasting glucose (mM)/22.5].
Relative and fold expressions
Relative adiponectin mRNA levels of both VAT and SAT were calculated using [(1/2)ΔCt], while fold expression changes were evaluated using the equation 2-ΔΔCt. The adiponectin mRNA levels of non-obese subjects were used as control to calculate the fold expression.
Statistical analysis
Data were summarized as mean ± SEM. The demographic characteristics and metabolic profile of the two groups were compared by Student’s t-test. The adiponectin mRNA levels within the groups were compared by paired t-test. Bivariate association between variables was carried out by Pearson correlation analysis. The age-adjusted multiple linear regression analysis was used to ascertain the relative association of adiponectin mRNA levels with metabolic risk factors, considering serum adiponectin and VAT and SAT adiponectin mRNA levels as the independent variables and metabolic risk factor the dependent variables. To determine the independent contribution of each adiponectin mRNA level on metabolic risk factors (TG, TC and HDL), the metabolic risk factors were further adjusted with BMI or WC (a marker of obesity). A two-tailed p<0.05 was considered statistically significant.
Results
A total of 68 postmenopausal women (non-obese=34 and obese=34) were studied. The demographic characteristics, metabolic profile, serum adiponectin, VAT and SAT adiponectin mRNA levels of non-obese and obese postmenopausal women are summarized in Table 1.
Demographic characteristics
The demographic characteristics, viz. BMI and WC, were found significantly (p<0.001) different and higher in obese as compared to non-obese. However, the age did not differ (p>0.05) between the two groups, i.e. it was found to be statistically the same. In other words, the subjects of the two groups were age-compatible.
Metabolic profile
In obese, the metabolic profile, viz. glucose and TG, were significantly (p<0.01 or p<0.001) higher, while HDL was significantly lower (p<0.01) as compared to non-obese. However, insulin, HOMA and TC and were found to be similar (p>0.05) between the two groups.
Adiponectin mRNA levels in adipose tissue
The serum adiponectin level was significantly (p<0.001) lower in obese as compared to non-obese. Further, the VAT and SAT adiponectin mRNA levels were also significantly (p<0.001) lower by 0.21 (44.1%) and 0.22 (42.9%)-fold, respectively, in obese as compared to non-obese. However, the VAT and SAT adiponectin mRNA levels did not differ (p>0.05) between the groups, i.e. they were found to be statistically the same (Figure 1).
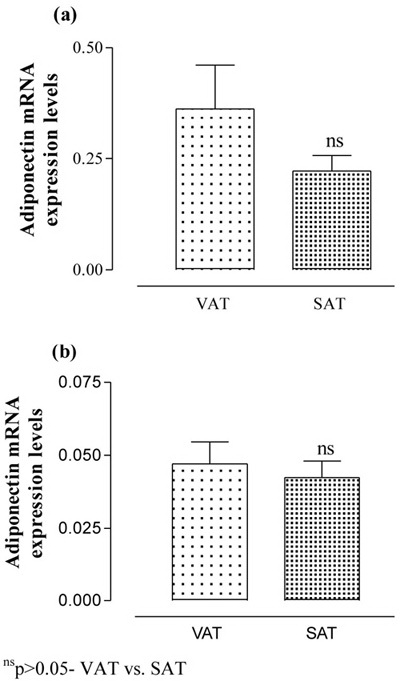
Figure 1. The VAT and SAT adiponectin mRNA expression levels of non-obese (a) and obese (b) postmenopausal women. Values are expressed as Mean ± SEM and compared by paired t-test.
Correlation
The inter-correlation of demographic characteristics, metabolic profile and adiponectin mRNA levels of all (non-obese and obese) postmenopausal women are summarized in Table 2. Table 2 shows that the age did not correlate (p>0.05) well with any of the variables. However, both BMI and WC demonstrate significant (p<0.001) and positive correlation with TG, while negative correlation (p<0.05 or p<0.01) with HDL, serum adiponectin, VAT and SAT adiponection mRNA levels. Similarly, VAT and SAT adiponectin mRNA levels showed significant (p<0.01 or p<0.001) and negative correlation with TG. Moreover, the VAT adiponectin mRNA level also showed significant (p<0.01) and positive correlation with the HDL. The correlation analysis pointed to an inverse and direct association especially of VAT adiponectin mRNA levels with metabolic TG (r=-0.40, p<0.001) and HDL (r=0.35, p<0.01), respectively, but the associations of both TG and HDL was also found to be dependent on BMI (TG: r=0.53, p<0.001; HDL: r=-0.37, p<0.01) and WC (TG: r=0.57, p<0.001; HDL: r=-0.34, p<0.01).
Multiple regression
To determine the independent association of serum adiponectin level, VAT and SAT adiponectin mRNA levels with metabolic risk factors (TG, TC and HDL), the multiple linear regression analysis was done adjusting for age without and with adjustment of BMI and is summarized in Table 3. Table 3 showed that the serum adiponectin level did not correlate (p>0.05) well with metabolic risk factors when adjusted for age and BMI. Similarly, SAT adiponectin mRNA level also did not show significant (p>0.05) association with TC and HDL. However, the SAT adiponectin mRNA level showed significant (p<0.01) association with TG (b=-1.11, 95% CI=-1.91 to -0.31; p=0.007), but the significance disappeared (p>0.05) when adjusted for age and BMI (b=-0.53, 95% CI=-1.30 to 0.24; p=0.176). In contrast, the VAT adiponectin mRNA level showed significant (p<0.01) association with both TG (b=-0.54, 95% CI=-0.85 to -0.23, p=0.001) and HDL (b=0.25, 95% CI=0.09 to 0.41; p=0.003), and also showed significant (p<0.05) association with both TG (b=-0.34, 95% CI=-0.64 to -0.04, p=0.027) and TC (b=0.18, 95% CI=0.01 to 0.34; p=0.034) after adjustment for age and BMI, indicating significant association independent of obesity (BMI). Further, the VAT adiponectin mRNA level also showed significant and obesity independent association with TG and TC when adjusted for age and WC (Figure 2).
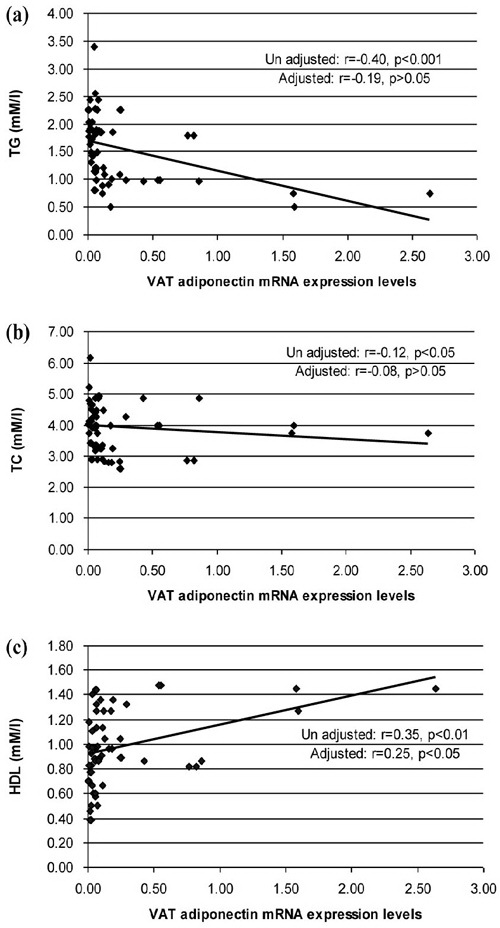
Figure 2. Unadjusted (adjusted with age) and adjusted (adjusted with age and WC) association of VAT adiponectin mRNA expression levels with metabolic risk factors (TG, TC and HDL) by multiple linear regr ession analysis.
Discussion
This study evaluated the effect of adiponectin mRNA levels on metabolic risk factors in postmenopausal women. The study found a significant effect especially of VAT adiponection mRNA expression level on TG and HDL. Moreover, the study also found significantly lower VAT and SAT adiponectin mRNA levels in postmenopausal obese as compared to postmenopausal non-obese. The findings of the present study are in good accordance with one previous study which showed 2 to 2.5-fold lower adiponectin mRNA in the VAT of T2D patients than controls.35 Further, the findings of the present study are also consistent with Fischer et al27 who showed significantly lower adiponectin gene expression and protein content in omental adipose tissue (VAT) and SAT of obese as compared to non-obese. However, the present study did not agree with that of Young et al,26 which showed no difference in VAT adiponectin mRNA levels of obese and non-obese women.
Cross-sectional studies have shown an inverse relationship between adiponectin mRNA and serum levels with BMI.7,11 Other studies have also demonstrated an inverse relationship between adiponectin, TG and LDL levels and a positive relationship with HDL independent of abdominal fat and degree of insulin resistance.26,36 The present study additionally showed a significant and independent association of VAT adiponectin mRNA level with TG and HDL when adjusted for age and BMI, thus suggesting its potential modulatory role in lipid metabolism. The manifestation of a potential modulatory/regulatory role of VAT adiponectin mRNA level in metabolic risk factors may be attributed to AMP-activated protein kinase which regulates lipid metabolism. Recently, a cross-sectional study also observed an inverse relationship between adiponectin and systolic blood pressure in overweight adolescents independent of adiposity.39
In mice, it has been well documented that the injection of recombinant adiponectin reduces the serum fatty acid levels, which was ascribed to the increased fatty acid β-oxidation in skeletal muscle.37 In addition, the increased β-oxidation of fatty acids is secondary to the activation of AMP-activated protein kinase.38 However, it appears to be plausible to speculate that higher adiponectin expression in visceral adipose tissue may decrease the spillover of fatty acids into the portal vein, thereby reducing the supply of substrate for hepatic VLDL synthesis.
The present study showed lower adiponectin mRNA in SAT of obese than non-obese and the finding corroborates an earlier study on diabetics.40 Further, in both visceral and subcutaneous adipose tissue has been also reported 6-fold lower in obese than lean individuals.41 However, the present study did not find any significant difference between VAT and SAT adiponectin mRNA levels either in non-obese or in obese, though in both the cases it was lower in SAT than VAT. The findings are in good agreement with the earlier study on isolated human explants/adipocytes, which also suggests an insignificant difference in adiponectin secretion from visceral or subcutaneous depots.42 Other studies also reported similar expression in visceral and subcutaneous fat in obese subjects.41,43,44 However, one study reports lower adiponectin expression in VAT than SAT in overweight subjects.27
Matsuzawa et al also reported reduced plasma adiponectin levels in obese subjects.7 Circulating adiponectin levels exhibit an inverse correlation with adipose tissue mass in adults.45-47 On the other hand, the present study did not find any association between serum adiponectin, VAT and SAT adiponectin mRNA levels. However, the present study did reveal a negative correlation of both VAT and SAT adiponectin mRNA levels with BMI and WC, the markers of obesity. The findings were similar to a previous study.48 The negative association may lead to obesity which is likely to affect health outcomes.21
One study reported that weight loss induced up-regulation of adiponectin expression of both fat depots.49In vivo and in vitro studies have demonstrated that adiponectin enhances insulin sensitivity, increases fatty acid oxidation and glucose uptake, and suppresses hepatic glucose production.50-54 These studies strongly indicate that adiponectin acts through multiple tissues to enhance insulin sensitivity, which explains why it is referred to as an insulin sensitizer. A recent study showed that adiponectin enhances insulin-stimulated IRS-1 tyrosine phosphorylation and Akt phosphorylation.55 The study further revealed that activation of the serine/threonine kinase 11/AMP-activated protein kinase (AMPK)/TSC1/2 pathway alleviates the p70S6 kinase-mediated negative regulation of insulin signaling, providing a mechanism by which adiponectin increases insulin sensitivity in cells. The present study found high insulin levels (non-obese: 10.84 ± 0.76 μU/ml, Obese: 11.64 ± 0.75 μU/ml) and HOMA (non-obese: 2.62 ± 0.19, Obese: 3.05 ± 0.20) in both non-obese and obese, but the difference did not reach statistical significant when a comparison was made between non-obese and obese. The high insulin and HOMA in both groups may be attributed to surgery related stress hormones as the blood samples were taken before the surgery.
In monkeys, it is well documented that lower serum adiponectin level is associated with obesity and starts to drop at an early phase of obesity.56 In contrast, reduction of body weight in obese subjects increases plasma adiponectin concentrations.57 These reports suggest that obesity-associated adiponectin level is reversible.
The present study concluded that there may be a significant role of omental adipose tissue in obesity, which inversely and directly regulates metabolic risk factors TG and HDL, respectively.
Acknowledgements:
We thank Dr. Shailendra, Dr. Surendra and the staff of Arushi Hospital Lucknow for assistance with subjectrecruitment.
Disclosure:
There is no conflict of interest.
REFERENCES
1. Kahn BB, Flier JS, 2000 Obesity and insulin resistance. J Clin Invest 106: 473-481.
2. Bergman RN, Ader M, 2000 Free fatty acids and pathogenesis of type 2 diabetes mellitus. Trends Endocrinol Metab 11: 351-356.
3. Saltiel AR, Kahn CR, 2001 Insulin signalling and the regulation of glucose and lipid metabolism. Nature 414: 799-806.
4. Berg AH, Combs TP, Scherer PE, 2002 ACRP30/adiponectin: an adipokine regulating glucose and lipid metabolism. Trends Endocrinol Metab 13: 84-89.
5. Matsuzawa Y, Funahashi T, Nakamura T, 1999 Molecular mechanism of metabolic syndrome X: contribution of adipocytokines adipocyte-derived bioactive substances. Ann N Y Acad Sci 892: 146-154.
6. Matsuzawa Y, Funahashi T, Kihara S, Shimomura I, 2004 Adiponectin and metabolic syndrome. Arterioscler Thromb Vasc Biol 24: 29-33.
7. Arita Y, Kihara S, Ouchi N, et al, 1999 Paradoxical decrease of an adipose-specific protein, adiponectin, in obesity. Biochem Biophys Res Commun 257: 79-83.
8. Yang WS, Lee WJ, Funahashi T, et al, 2002 Plasma adiponectin levels in overweight and obese Asians. Obes Res 10: 1104-1110.
9. Valle M, Martos R, Gascón F, Cañete R, Zafra MA, Morales R, 2005 Low-grade systemic inflammation, hypoadiponectinemia and a high concentration of leptin are present in very young obese children, and correlate with metabolic syndrome. Diabetes Metab 31: 55-62.
10. Hotta K, Funahashi T, Arita Y, et al, 2000 Plasma concentrations of a novel, adipose-specific protein, adiponectin, in type 2 diabetic patients. Arterioscler Thromb Vasc Biol 20: 1595-1599.
11. Weyer C, Funahashi T, Tanaka S, et al, 2001 Hypoadiponectinemia in obesity and type 2 diabetes: close association with insulin resistance and hyperinsulinemia. J Clin Endocrinol Metab 86: 1930-1935.
12. Matsubara M, Maruoka S, Katayose S, 2002 Decreased plasma adiponectin concentrations in women with dyslipidemia. J Clin Endocrinol Metab 87: 2764-2769.
13. Fox CS, Massaro JM, Hoffmann U, et al, 2007 Abdominal visceral and subcutaneous adipose tissue compartments association with metabolic risk factors in the framingham heart study. Circulation 116: 39-48.
14. Poirier P, Després JP, 2003 Waist circumference, visceral obesity, and cardiovascular risk. J Cardiopulm Rehabil 23: 161-169.
15. Klein S, 2004 The case of visceral fat: argument for the defense. J Clin Invest 113: 1530-1532.
16. Goodpaster BH, Krishnaswami S, Resnick H, et al, 2003 Association between regional adipose tissue distribution and both type 2 diabetes and impaired glucose tolerance in elderly men and women. Diabetes Care 26: 372-379.
17. Kanaya AM, Harris T, Goodpaster BH, Tylavsky F, Cummings SR, 2004 Health, Aging, and Body Composition (ABC) Study: Adipocytokines attenuate the association between visceral adiposity and diabetes in older adults. Diabetes Care 27: 1375-1380.
18. Matsuzawa Y, 2006 Therapy insight: adipocytokines in metabolic syndrome and related cardiovascular disease. Nat Clin Pract Cardiovasc Med 3: 35-42.
19. Wajchenberg BL, 2000 Subcutaneous and visceral adipose tissue: their relation to the metabolic syndrome. Endocr Rev 21: 697-738.
20. Yatagai T, Nagasaka S, Taniguchi A, et al, 2003 Hypoadiponectinemia is associated with visceral fat accumulation and insulin resistance in Japanese men with type 2 diabetes mellitus. Metabolism 52:1274-1278.
21. Bacha F, Saad R, Gungor N, Arslanian SA, 2004 Adiponectin in youth relationship to visceral adiposity, insulin sensitivity, and beta-cell function. Diabetes Care 27: 547-552.
22. Saijo Y, Kiyota N, Kawasaki Y, et al, 2004 Relationship between C-reactive protein and visceral adipose tissue in healthy Japanese subjects. Diabetes Obes Metab 6: 249-258.
23. Nielsen S, Guo Z, Johnson CM, Hensrud DD, Jensen MD, 2004 Splanchnic lipolysis in human obesity. J Clin Invest 113: 1582-1588.
24. Sam S, Haffner S, Davidson MH, et al, 2008 Relationship of abdominal visceral and subcutaneous adipose tissue with lipoprotein particle number and size in type 2 diabetes. Diabetes 57: 2022-2027.
25. Arner P, 1998 Not all fat is alike. Lancet 351: 1301-1302.
26. Yang WS, Chen MH, Lee WJ, 2003 Adiponectin mRNA levels in the abdominal adipose depots of nondiabetic women. Int J Obes Relat Metab Disord 27: 896 -900.
27. Fisher FM, McTernan PG, Valsamakis G, et al, 2002 Differences in adiponectin protein expression: effect of fat depots and type 2 diabetic status. Horm Metab Res 34: 650-654.
28. Lihn AS, Ostergard T, Nyholm B, Pedersen SB, Richelsen B, Schmitz O, 2002 Adiponectin mRNA expression in subcutaneous adipose tissue is reduced in first-degree relatives of type 2 diabetic patients. Am J Physiol Endocrinol Metab 284: E443-E448.
29. Bjorntorp P, 1992 Metabolic abnormalities in visceral obesity. Ann Med 24: 3-5.
30. Fried SK, Bunkin DA, Greenberg AS, 1998 Omental and subcutaneous adipose tissues of obese subjects release interleukin-6: depot difference and regulation by glucocorticoid. Clin Endocrinol Metab 83: 847-850.
31. Lu HL, Wang HW, Wen Y, Zhang MX, Lin HH, 2006 Roles of adipocyte derived hormone adiponectin and resistin in insulin resistance of type 2 diabetes. World J Gastroenterol 12: 1747-1751.
32. Altomonte J, Harbaran S, Richter A, Dong H, 2003 Fat depot-specific expression of adiponectin is impaired in Zucker fatty rats. Metabolism 52: 958-963.
33. The World Health Report 2002 Reducing Risks, Promoting Healthy Life World Health Organization, Geneva.
34. Matthews DR, Hosker JP, Rudenski AS, Naylor BA, Treacher DF, Turner RC, 1985 Homeostasis model assessment: insulin resistance and β-cell function from fasting plasma glucose and insulin concentrations in man. Diabetologia 28: 412-419.
35. Statnick MA, Beavers LS, Conner LJ, et al, 2000 Decreased expression of apM1 in omental and subcutaneous adipose tissue of humans with type 2 diabetes. Int J Exp Diabetes Res 1: 81-88.
36. Cnop M, Havel PJ, Utzschneider KM, et al, 2003 Relationship of adiponectin to body fat distribution, insulin sensitivity and plasma lipoproteins: evidence for independent roles of age and sex. Diabetologia 46: 459-469.
37. Fruebis J, Tsao TS, Javorschi S, et al, 2001 Proteolytic cleavage product of 30-kDa adipocyte complement-related protein increases fatty acid oxidation in muscle and causes weight loss in mice. Proc Natl Acad Sci USA 98: 2005-2010.
38. Yamauchi T, Kamon J, Minokoshi Y. et al,2002 Adiponectin stimulates glucose utilization and fatty acid oxidation by activating AMP-activated protein kinase. Nat Med 8: 1288-1295.
39. De Las Heras J, Lee S, Bacha F, et al, 2011 Cross-sectional association between blood pressure, in vivo insulin sensitivity and adiponectin in overweight adolescents. Horm Res Paediatr 76: 379-385.
40. Kouidhi S, Jarboui S, Marrakchi R, et al, 2011 Adiponectin expression and metabolic markers in obesity and type 2 diabetes. J Endocrinol Invest 34: e16-23.
41. Lihn AS, Bruun JM, He G, Pedersen SB, Jensen PF, Richelsen B, 2004 Lower expression of adiponectin mRNA in visceral adipose tissue in lean and obese subjects. Mol Cell Endocrinology 219: 9-15.
42. Fain JN, Madan AK, Hiler ML, 2004 Comparison of the release of adipokines by adipose tissue, adipose tissue matrix and adipocytes from visceral and subcutaneous abdominal adipose tissues of obese humans. Endocrinology 145: 2273-2282.
43. Degawa-Yamauchi M, Moss KA, Bovenkerk JE, et al, 2005 Regulation of adiponectin expression in human adipocytes: effects of adiposity, glucocorticoids, and tumor necrosis factor alpha. Obes Res 13: 662-669.
44. Fredriksson J, Carlsson E, Orho-Melander M, Groop L, Ridderstråle M, 2006 A polymorphism in the adiponectin gene influences adiponectin expression levels in visceral fat in obese subjects. Int J Obes (Lond) 30: 226-232.
45. Hu E, Liang P, Spiegelman BM, 1996 AdipoQ is a novel adipose-specific gene dysregulated in obesity. J Biol Chem 271: 10697-10703.
46. Kern PA, Di Gregorio GB, Lu T, 2003 Adiponectin expression from human adipose tissue: relation to obesity, insulin resistance, and tumor necrosis factor-alpha expression. Diabetes 52: 1779-1785.
47. Abbasi F, Chu JW, Lamendola C, et al, 2004 Discrimination between obesity insulin resistance relationship with adiponectin. Diabetes 53: 585-590.
48. Motoshima H, Wu X, Sinha MK, et al, 2002 Differential Regulation of Adiponectin Secretion from Cultured Human Omental and Subcutaneous Adipocytes: Effects of Insulin and Rosiglitazone. J Clin Endocrinol Metab 87: 5662-5667.
49. Coughlin CC, Finck BN, Eagon JC, et al, 2007 Effect of Marked Weight Loss on Adiponectin Gene Expression and Plasma Concentrations. Obesity 15: 640-645.
50. Berg AH, Combs TP, Du X, Brownlee M, Scherer PE, 2001 The adipocyte secreted protein Acrp30 enhances hepatic insulin action. Nat Med 7: 947-953.
51. Fruebis J, Tsao TS, Javorschi S, et al, 2001 Proteolytic cleavage product of 30-kDa adipocyte complement-related protein increases fatty acid oxidation in muscle and causes weight loss in mice. PNAS 98: 2005-2010.
52. Yamauchi T, Kamon J, Waki H, et al, 2001 The fat-derived hormone adiponectin reverses insulin resistance associated with both lipoatrophy and obesity. Nat Med 7: 941-946.
53. Wu X, Motoshima H, Mahadev K, Stalker TJ, Scalia R, Goldstein BJ, 2003 Involvement of AMP-activated protein kinase in glucose uptake stimulated by the globular domain of adiponectin in primary rat adipocytes. Diabetes 52: 1355-1363.
54. Combs TP, Berg AH, Obici S, Scherer PE, Rossetti L, 2001 Endogenous glucose production is inhibited by the adipose-derived protein Acrp30. J Clin Invest 108: 1875-1881.
55. Wang C, Mao X, Wang L, et al, 2007 Adiponectin sensitizes insulin signaling by reducing p70 S6 kinase mediated serine phosphorylation of IRS-1. J Biol Chem 282: 7991-7996.
56. Hotta K, Funahashi T, Bodkin NL, et al, 2001 Circulating concentrations of the adipocyte protein adiponectin are decreased in parallel with reduced insulin sensitivity during the progression to type 2 diabetes in rhesus monkeys. Diabetes 50: 1126-1133.
57. Yang WS, Lee WJ, Funahashi T, et al, 2001 Weight reduction increases plasma levels of an adipose-derived anti-inflammatory protein, adiponectin. J Clin Endocrinol Metab 86: 3815-3819.
Address for correspondence:
Dr. Sunita Tiwari, Professor and Head, Department of
Physiology, C.S.M. Medical University, Lucknow-226003,
India, Τel.: 0522-2257542, Fax: 0522-2257539,
E-mail: research.physiology@gmail.com
Received 18-02-12, Accepted 30-05-12