Abstract
OBJECTIVE: To examine the effects of three seasonal training programs, largely different in strength volume, on androgen levels and performance parameters in soccer players. DESIGN: Sixty-seven soccer players, members of three different professional teams, participated in the study. Strength intensity of the training programs were assessed as high (for Team-A, n=23), moderate (for Team-B, n=22), and low (for Team-C, n=22). Blood samples were analyzed for total-testosterone, free-testosterone, and the metabolic product of activate testosterone 3a-androstendiol glucuronade (3a-Diol-G). Players were tested for maximal oxygen consumption (VO2max), squad-jump (SJ), countermovement-jump (CMJ), 10m and 20m sprint performance prior at the beginning of the pre-season period, at the middle (mid-point), and at the end of the competition period (end-point). RESULTS: All performance parameters increased significantly until mid-point in all teams (p<0.001). However, performance was further increased only in Team-A only for jumping and sprinting ability between end-point vs mid-point (p<0.001). An effect of the training program of Team-A on TT levels was evident exhibiting significant differences between at all point-measurements (baseline/mid-point:p=0.024, baseline/end-point:p<0.001, mid/end-point:p=0.008), while a marginally significant effect (p=0.051) was detected within Team-B and a non-significant effect in Team-C. Similar results were obtained for 3a-Diol-G in Team-A (p=0.001) where significant differences were found between end-point to both baseline (p=0.001) and mid-point (p=0.038). No differences were detectable for FT. A borderline significant negative correlation was observed between 3a-Diol-G and VO2max in Team-B at mid-point. No other correlations were evident between performance and hormonal parameters. CONCLUSION: Our findings suggest that the volume of strength training combined with intensive soccer training caused an elevation of circulating TT and 3a-Diol-G levels in parallel to the induction of performance capacity. It is our opinion that the elevation of endogenous androgens as a result of the volume of strength training indicates that the only method to improve athletic performance is hard training. There are no substitutes or shortcuts. If the organism needs more androgens it will produce them endogenously.
INTRODUCTION
The main androgen, testosterone, affects a variety of parameters such as body composition, muscle metabolism and function, protein synthesis, and muscle mass.18,23 These parameters are related with the ability to perform efficiently during exercise.23,35,39 Furthermore, previous findings from different athletic populations indicate a linear relationship between maximal explosive force,5 force production,22 jumping and sprinting ability8,30,32 and testosterone levels. The association between testosterone and exercise is bidirectional, i.e. testosterone affects exercise and is affected by it. Indeed, testosterone response to exercise is a result of a combination of different factors such as volume, intensity, type of exercise, and training status of the subjects.24,46 It is generally accepted that endurance training19 tends to decrease testosterone resting values, whereas strength exercise can increase its basal levels during periods of high volume32 and high intensity training44 in response to long22 or short training periods.44
Soccer is a high intensity intermittent exercise that combines aerobic and anaerobic activities and places considerable demands on the neuromuscular and hormonal systems.4 Although the main metabolic functions in soccer are sustained by aerobic metabolism,14 the ability of the neuromuscular system to produce maximal strength and power and their derivatives (sprints, jumps, acceleration) appears to be of crucial importance.4 As a consequence of the demands placed on soccer players, the current conditioning programs involve the development of specific physical capacities such as endurance, speed, strength, and power. However, maintenance of or improvement in performance are not solely dependent on sufficient conditioning. It is now believed that several other factors influence exercise performance, among which is circulating testosterone.8,32
The association between soccer and testosterone levels is complex and still controversial. Thus, periods of high intensity training in soccer reduce testosterone basal concentration,14 whereas its levels remain unchanged16 or increase29 as a response to regular soccer training. Meanwhile, very few interventional studies have been conducted presenting data on the combination of soccer training and strength sessions. The existing literature suggests that the combination of soccer training with linear or non-linear strength sessions results in increased total testosterone (TT) basal levels and neuromuscular performance17,40 but does not affect free testosterone (FT) and endurance capacity.17
The aim of the present work was to examine the effects of three different seasonal soccer training programs on serum levels of TT, FT, and the metabolic product of activated testosterone 3a-Androsten-diol-glucuronade (3a Diol G)34 as well as on exercise performance. More specifically, we examined the effects of different soccer training regimes on the fluctuation of androgen levels and performance over time (pre-season period until the end of the championship). The training programs differed among the three teams, i.e. high volume training program in Team A, moderate in Team B, and low in Team C. The difference involved (a) volume and load of general (GSC) and (b) soccer-specific strength training (SPS) (a common training method in today’s soccer training). The effects were measured by maximal oxygen consumption (VO2max) and neuromuscular performance parameters, i.e. squat jump (SJ), countermovement jump (CMJ), and sprint performance. To assess the effect of the three training programs on circulating endogenous androgens, we measured total-testosterone (TT), free-testosterone (FT), and 3a-androsten-diol-glucuronade (3a-Diol-G).Finally, we examined the association between changes in performance parameters to changes of levels of endogenous androgens. Our working hypothesis was that the higher the volume, the better the performance parameters and the higher the endogenous androgen levels.
MATERIALS AND METHODS
Subjects
Sixty-seven male professional soccer players, members of two Greek Superleague teams (Team A: n=23, Team B: n=22) and one Greek Football League 2 team (Team C: n=22) participated in this study. All the participants had been professional soccer players for more than 5 years. A detailed medical history was recorded. Exclusion criteria were as follows: a) any medical or endocrine disorder that could affect their ability to participate in the study and/or affect endogenous hormonal production; b) suspicion of use of exogenous hormonal agents or of other illegal substances; and c) absence from the normal training program for more than 15 days. The individual players incorporated in the study had comparable anthropometric measures, suggesting homogeneity of the sample at the beginning of the study. Their age, weight, and height characteristics ±SD were as follows: Team A: age (years)=25.5±1.1, weight (kg)=79.1±1.3, height (cm)=182±2.3; Team B: age (years)=24.7±1, weight (kg)=79.5±1.9, height (cm)=181±1.4; Team C: age=23.8±0.9, weight (kg)=79.7±1.2, height (cm)=181±1.1. Players received verbal explanation for the study and a written consent was obtained. The study was conducted according to the declaration of Helsinki and was approved by the ethics committee of the university.
Study Design
The study was performed over a period of 10½ months (42 weeks), i.e. from the beginning of the pre-season period until the end of the championship. The players were evaluated three times: a) baseline: just before the beginning of the pre-season period (early in July); b) mid-point: in the first half of the in-season period (January); and c) end-point: at the end of the season (mid-May). Prior to each testing period, players were under no exercise stress for at least two days to avoid any fatigue effects. Each experimental session included two days of consecutive testing. In the morning of the first day, anthropometric characteristics were measured (08:30 am) and venous blood samples were obtained (from 09:00 to 10:30 am) to determine the concentration of testosterone assessed by three assays, i.e. TT, FT, and 3a Diol G. In the afternoon of the same day (17:00 pm), players were tested for neuromuscular performance assessed by two different measurements, i.e. squat and countermovement jump (SJ and CMJ, respectively) and speed performance assessed by two measurements, i.e. 10m and 20m sprint. On the morning of the second day (09:30 am), maximal oxygen consumption (VO2max) was performed. All hormonal and exercise performance measurements were performed during all three experimental sessions at the same time of the day and players were tested in the same order to avoid any circadian variation in the measured variables. The measurement for the determination of one repetition maximum (1RM) was performed only at pre-season for the specific strength exercises used in our study. This testing took place the day after the VO2max assessment starting at 10:00 am. Before each experimental session, players were requested to avoid consuming any supplement that could promote performance at least 2 days prior to the testing to keep their hydration status as well as to avoid any caffeine or alcohol beverages at least 3 hours prior to each testing. Nutritional guidelines were given to all players in order to ensure a >60% carbohydrate dietary intake during the study. All players were familiar with the testing protocol, as they had been previously tested with the same procedures on several occasions during the last soccer season.
Training
Playing Schedule and training program
During the whole experimental period, players of Teams A, B, and C participated in 33, 32, and 33 official (competition and cup) games, respectively. The training program for the three experimental teams was designed by the team coaches with the cooperation of the researchers. During both pre-season and competition periods, players participated in approximately 75-95 minute mean duration training sessions, focusing on all aspects of physical conditioning and technical-tactical elements of the game (Table 1). Categorizing Training Sessions: In order to analyze and evaluate the weekly training load, specific sub-components of each session were categorized according to the conditioning target of each training session as follows: Technical-Tactical training (TT) and Technical-Tactical Conditioning (TTC) both performed in conjunction with soccer drills such as small sided games (SSG) and big sided games (BSG), speed and agility conditioning (SAC), endurance conditioning (EC) when running was performed (without the ball), general strength conditioning (GSC), and soccer-specific strength training (SPS). The strength sessions employed were categorized according to the recommendations by Baker (1996) as follows: general strength (aiming to increase maximal strength), special strength (aiming to train for power once strength levels have increased), and specific strength (aiming to train the specific skills needed during an actual competition).
Preparation Period
During the pre-season period, participants of Teams A, B, and C participated in 74, 63, and 52 training sessions, respectively, in a period of 7 weeks. Players of Teams A and B participated in the same number and nature (training volume, load, and intensity) of training sessions including TT (15 sessions), TTC (+SSG, BSG; 20 sessions), SAC (4 sessions), EC (9 sessions), whereas players of Team C had a similar number of TTC (+SSG, BSG; 20 sessions) and SAC (4 sessions), and slightly lower training sessions in TT (11) and EC (6 sessions). The main difference between Teams A, B, and C consisted in the number of SPS and GSC (Team A: GSC=11, SPS=15; Team B: GSC=6, SPS=9; Team C: BSC=4, SPS=7). During the seventh week of the pre-season period all teams followed their in-season weekly training plan (Table 1). During this phase all friendly games were recorded as TTC. In-season Period: The in-season weekly training plan was kept constant by each team throughout the competition period (Table 1). The weekly training program was different mainly regarding the number and the nature of the SPS and GSC sessions performed by each team (Tables 1, 2). Apart from the different weekly number of SPS sessions in each team, an extra training session was performed by the players of Team A on the morning of the match-day (Table 1). During the competition phase Teams A, B, and C had 3, 2, and 1 cup matches, respectively, at mid-week (Wednesdays). During these “cup-weeks”, the training plan was different including two recovery sessions, two low intensity-low volumes TT sessions, and one SAC session in all teams.
Categorizing the three training programs
The three seasonal training programs were different regarding the volume and the load of the strength training sessions. Therefore, the seasonal training regimes were categorized as follows: high strength training stress, moderate strength training stress, and low strength training stress for Teams A, B, and C, respectively. Training Load, Volume, and Intensity:The training load of each session was assessed with the use of the 10-point RPE scale modified by Foster et al (1995). The training load calculation and assessment was performed according to standard procedures.15 In order to control the training load and to avoid any overtraining effect that would negatively affect both the adrenal and gonadal axes as well as exercise performance,47 the daily “training monotony” (average daily training load/standard deviation of the daily training load calculated over a week) was measured. In regard to training volume, it was expressed during the study as total number of training sessions and training time in minutes (min). Heart Rate maximal (HR max) assessment was performed using HR monitors (Polar Team2 Pro, Polar Electro, Oy, Finland) to determine the training zones (<50-60% of HR max, 60-70% of HR max, 70-80% of HR max, 80-90% of HR max, 90-100% of HR max). Soccer-Specific Strength (SPS):All three experimental teams employed SPS sessions of 35-40 minutes duration throughout the study but at a different weekly frequency (Table 1). Soccer-specific strength has been defined as the ability of a player to use muscle strength and power effectively and consistently throughout the soccer season.4 These sessions included various forms of activities such as skipping over cones, jumping on one or two legs, jumping over hurdles or obstacles, shooting, heading, acceleration, repeated sprints, eccentric movements such as deceleration and stopping, changes of direction, etc.,36 combined with maximal intensity soccer activities such as crossing, shooting, and heading . All performed drills in each SPS were similar in nature, duration, and volume. During every SPS, the number of plyometric exercises (jumps) was kept constant at 45 jumps per session for each individual. General Strength Conditioning (GSC):General strength conditioning was used by all teams (Table 1). Teams B and C employed the same high intensity, low load GSC regime, whereas Team A players followed a high intensity, moderate volume strength training regime in conjunction with two core strength exercises performed in a circuit manner (Table 2).
Laboratory Measurements
Anthropometry
At each experimental session, height was measured using a stadiometer (Charder HM0D, Charder Electronics CO, LTD, Taiwan) and body weight (BW) was obtained using an electronic weight scale (Seca Alpha 770, Seca Vogel, Hamburg, Germany). Body fat percentage (BF%) was assessed by skinfold thickness measurement (Lange Skinfold Caliper, Cambridge Scientific Instruments, Cambridge, UK) using the 4 spot formula by Jackson and Pollock (1978). All measurements were made by the same investigator.
Exercise Performance
The jumping (SJ, CMJ) and sprinting ability (10m, 20m) of the soccer players were assessed with a jumping mat (Powertimer, Newtest Ltd., Oulu, Finland) and infrared photoelectric cells (Powertimer, Newtest Ltd., Oulu, Finland), respectively, according to standard procedures.7 VO2max assessment was performed on a motorized treadmill using an automated gas-analysis system (VMAX29, Sensormedics, Yorba Linda, CA), with the use of set procedures of a standard protocol.28 Finally, 1RM assessment was performed with the use of free weight exercises or machine weight exercises (Cybex International, Inc. USA) according to suggested procedures.33
Blood Collection and Analysis
On each test day, venous blood samples were obtained following a period of 10-minute rest in a lying position. Serum blood samples were collected in tubes containing a clot activator and serum gel separator and were centrifuged at 3000 rpm for 10 minutes to separate serum. Serum samples then were stored at -20oC till analysis. TT levels were measured using the AIA fully automated immunoassay analyzer (TOSOH-Eurogenetics). The sensitivity of the assays for TT was 7 ng/ml and the intra- and inter-assay coefficient of variation was 3.1-5.2% and 2.48-5.99%, respectively. FT and 3a Diol G levels were measured using an enzyme-linked immune absorbent assay (Alpco Diagnostics, Windham, NH). The sensitivity of the assay for FT was 0.17 pg/ml and the intra- and inter-assay coefficient of variation were 4.7-17% and 5.3-12.4%, respectively. The sensitivity of the assay for 3a Diol G was 0.1 ng/ml and the intra- and inter- assay coefficient of variation was 6-7.8 and 6.5-10.8, respectively. All procedures were carried out according to the instructions of the manufacturer. All samples were analyzed in duplicates.
Statistical Analysis
Differences at baseline between the three groups in all hormonal, performance, body composition parameters, training load, and training volume were examined in the context of univariate ANOVAs. When equal variance was assumed, Bonferroni adjustments were employed, while in cases where assumption of homogeneity of variance was violated, the Welch test and DunnetT3 adjustment were used. Pearson’s (for normally distributed variables) and Spearman’s (for non-normally distributed variables) correlation coefficients were used to assess the linear relationship between variables. Evaluation of the effects on all measured variables in question (performance parameters: VO2max, SJ, CMJ, 10m, 20m; body composition parameters: body weight, %fat body composition; androgen: total testosterone, free testosterone, 3aDiol) of each training regime over time was pursued through a series of two-way 3×3 mixed ANOVA with season time (baseline, mid-point, end-point) as the within subjects variable and training regime (Team A representing high training load, Team B moderate and Team C low training load) as the between-subjects variable. Significance was set at p<0.05. Power analyses indicated that for the effect size of interactions observed in the study, estimated power for detecting significant simple effects ranged between 0.89 and 0.96 at alpha=0.05. Statistical analysis was performed using the software program SPSS 19 and power analysis was conducted with GPower 3.1.
RESULTS
Differences in performance variables and androgen levels between teams at baseline
No significant differences were observed at baseline between the three experimental groups in any of the measured performance (VO2max, SJ, CMJ, 10m, 20m) or body parameters (weight, fat%). Similarly, no significant differences were observed at baseline between the three experimental groups regarding circulating TT and 3a Diol G. A significant difference between teams was revealed for FT (p=0.013), with Team A (M=13.70) being different from Team C (M=9.26) at ad hoc test comparison (p=0.015; Bonferroni adjusted).
Volume and Training Load (RPE)
In order to confirm the intentional differentiation between the three training regimens, one-way ANOVAs were used to test volume and training load (as expressed by RPE) among the three teams within the same training period. As expected (Table 3), teams significantly differed both in volume (pre-season p=0.001, 1st half of competition period p<0.001, 2nd half of competition period p0.001) and RPE (pre-season p<0.001; 1st half of competition period F: 2,48=1848,63 p<0.001; 2nd half of competition period p 0.001).
Relationships between changes of performance parameters and circulating androgens
A weak significant negative correlation was evident between VO2max and 3a Diol G levels (p=0.012) at the end of the study in Team B. However, no other significant correlation was observed throughout the study in Teams A, B, and C between androgens (TT, FT, and 3a Diol G) and performance parameters. It should be mentioned that analysis of our data revealed some p values within the range 0.05<p-value<0.10. These insignificant correlations could be a result of the sample size. These correlations were between TT and both SJ (mid-point: p=0.055, and end-point: p=0.077) and CMJ (mid-point: p=0.053) in Team A, between 3a Diol G and VO2max (baseline: p=0.075), and TT and SJ (end-point: p=0.061) in Team B, and FT with both SJ (baseline: p=0.082) and 20m (end-point: p=0.055).
Performance
Two-way mixed ANOVAs showed a significant interaction between the time points of evaluation i.e. beginning of season (early July), mid-point (midJanuary) and end-point (mid-May) and the training regime used. As expected there was a considerable improvement over time in all performance parameters within each experimental team (Table 4). Neuromuscular Performance, assayed by SJ and CMJ, showed a significant increase (p<0.001) at the mid- and end-point measurements compared to baseline and a significant decrease (p<0.001) of sprint times (10 and 20 m) for all three teams, in ad hoc Bonferroni adjusted comparisons test of simple effects. In Team A, the comparison between mid- to end-point further revealed a significant increase in SJ (p<0.001), CMJ (p<0.001), and a significant decrease in 10m (p<0.001) and 20m (p<0.001) sprint times at the end of the study. No significant differences were revealed by the mid- to end-point comparison for any of the measured neuromuscular performance parameters in Team B (SJ p=0.383, CMJ p=1.00, 10m p=0.126, and 20m p=1.00) and Team C (SJ p=0.609, CMJ p=1.00, 10m p=1.00, and 20m p=1.00). Maximal Oxygen Consumption: The comparison between baseline to mid-point and end-point showed that there were significant increases (p<0.001) across all teams in VO2max. No significant differences were revealed for end- to mid-point comparisons for VO2max in Team A (p=0.057), Team B (p=1.000), and Team C (p=1.000) (Table 4). Body Composition: The BW and BF% assessments throughout the study are also presented in Table 4. For Team A (high strength training stress) and team B (moderate strength training stress), ad hoc comparisons between simple effects showed significant decreases in BW (p<0.001) between baseline to mid- and end-point measurements, but regarding BF% only Team A exhibited further loss of body fat between mid- to end-point (p<0.001) in contrast to Team B (p=0.782). For Team C, weight loss and body fat reduction were found significant only at mid-point to baseline (p=0.008 and p=0.025, respectively).
Endogenous androgen levels
Two-way mixed ANOVA revealed that the main effect of training regime (teams) on TT was not significant (p=0.117), but a significant main effect of time on TT was found (p<0.001). The two factors had a significant interaction (p=0.018), depicted in Figure 1 (cell means interaction). Simple effect analysis of season within each level of training regime revealed a significant difference within Team A (p<0.001), a marginal difference within Team B (p=0.051), and a non-significant difference within Team C (p=0.427). Post hoc comparisons (Bonferroni adjusted) in Team A showed significant differences between all season comparisons (baseline/mid-point: p=0.024, baseline/end-point: p<0.001, mid/end-point: p=0.008). Mean values of TT by each training regime over time are shown in Table 4. The main effect of training regimens on FT was significant (p=0.001), while a marginal finding of season was found (p=0.044). There was no significant interaction between the two factors for FT (Figure 1). In contrast, 3a Diol G exhibited a significant dependence on the type of training program (p<0.001) but not on the time periods (p=0.211). The interaction between factors was significant (p=0.024; Figure 1), with simple effects showing that only in the high training load team (Team A) was the effect of time significant (p=0.001). Within this team, post hoc test comparisons (Bonferroni adjusted) revealed a significant difference between baseline- and mid-point to end-point values (p=0.001 and p=0.038, respectively).
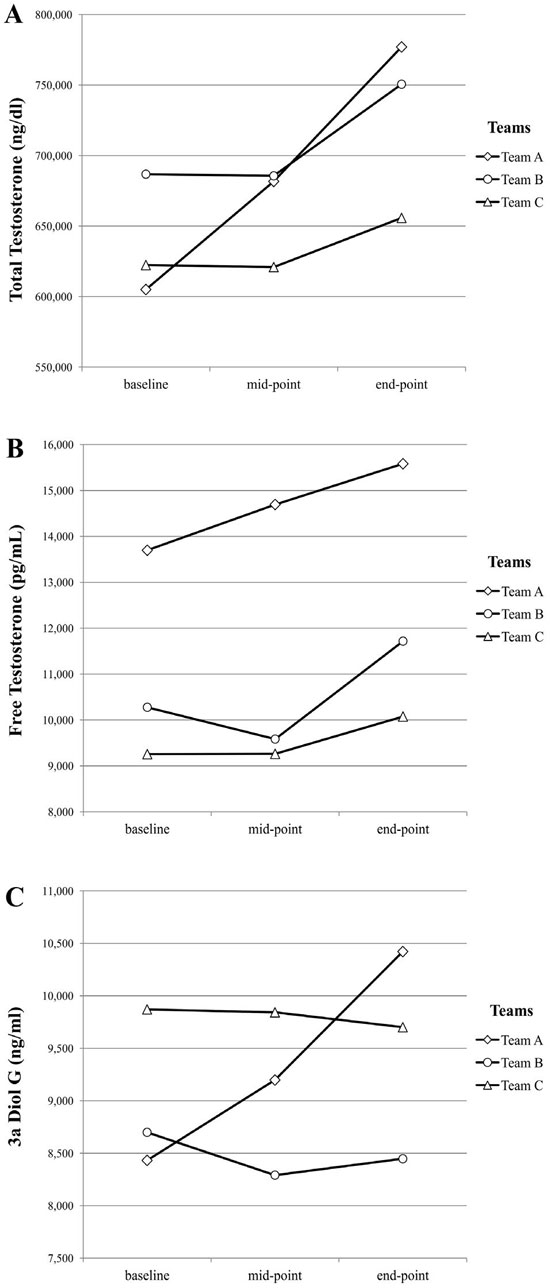
Figure 1. Cell mean interactions by training regimen (high strength training stress=Team A; moderate strength training stress=Team B, low strength training stress=Team C) over time for Total Testosterone (A), Free Testosterone (B), and 3a Diol G (C). Significant differences were observed only in Team A between baseline to mid- and end-point for both total testosterone (TT) and 3a Diol G and at the mid- to end-point comparison in TT.
DISCUSSION
The aim of this study was to examine the effects of three different seasonal training programs regarding strength volume on hormonal and performance parameters in soccer players. Our main finding is that the combination of soccer training with general and soccer-specific strength training can induce an elevation of TT and 3a Diol G. These changes appear to be mainly related to the volume of strength training since they both responded in proportion to volume, i.e. the higher the volume of strength training (Team A), the higher the resulting alterations. These changes in androgen levels do not correlate with any of the examined performance parameters. The only borderline correlation observed was between 3a Diol G to VO2max at the mid-point measurement in Team B. Regarding exercise performance and body composition variables, all training programs managed to induce beneficial alterations in these parameters until mid-season, which was retained until the end of the season. However, only the high strength training stress of Team A resulted in further significant changes in neuromuscular performance (SJ, CMJ, 10m 20m), body fat percentage, and body weight in the second half of the study.
To the best of our knowledge, only two published intervention studies in soccer exist in the literature.17,40 Both studies reported comparable results to ours. More specifically, the combination of regular soccer training with two40 or three17 strength training sessions, during an 11-week in-season and a 12-week pre-season period, respectively, managed to increase TT resting levels, whereas one session per week did not appear to alter TT.17 It should be noted here that in our teams the training scheme employed in Teams A was composed of three strength training session, in Team B two strength training session per week while Team C had only one. These similarities in the weekly strength training frequency provides supportive evidence to our own findings.
However, the TT changes in Teams A and B were evident in a different manner. The high strength stress training program employed by Team A managed to increase significantly TT resting levels at the mid-point measurement, followed by a further significant increase at the end of the study, whereas players of Team B exhibited only a tendency to increase TT resting levels, as highlighted by the mean values at the end of the study compared to baseline (Table 4). We postulate that the TT responses observed in Teams A, B, and C were the result of the different strength training volume employed by each of the three teams. Indeed, the three types of seasonal training programs were significantly different in training volume and load throughout the study (Table 3). Team A had the highest values in these two parameters compared to the other two experimental teams, while Team B had significantly higher values compared to Team C (Table 3). The seasonal training plan was organized in such a manner as to differ mainly regarding the weekly volume/frequency of the sessions aiming to improve general and soccer-specific strength. Regarding the other aspects of physical conditioning, the training programs employed by Teams A and B were nearly identical and slightly differed compared to Team C (Table 1). Therefore, the differences observed between the weekly training volume and load were mainly the result of the different strength training stress employed by each team. Confirmation of our suggestion of a volume/load-dependant TT response comes from the observations of previously published studies. It has been reported that strength training which results in high volume,32 high intensity,44 and high training load24 can increase TT resting levels. These changes may occur in response to long21 or even short training periods.44 Therefore, we could suggest that the higher strength training stress employed by Team A was more effective in providing a sufficient stimulus for a more pronounced TT increase compared to the moderate strength training stress of Team B. Similarly, Team B’s training program managed to provide sufficient stimulus to induce a detectable though non-significant elevation in TT levels (Table 4, Figure 1) (end of study vs baseline) compared to the low strength training stress of Team C that did not appear to affect TT levels. It should be mentioned that the extra sprint session performed on the morning of each match-day in Team A was unlikely to make any significant contribution to TT response, as it has previously been reported that sprint training suppresses TT rather than elevates it.2 The elevation of TT observed in Team B at the end of the study was not significant, in contrast to what has been reported by Pacobahyba et al (2012), who have shown that soccer training combined with two strength sessions per week can significantly elevate TT levels. This discrepancy could be due to the nature of the strength training regimes employed by our Team B (general and soccer specific strength) and the Pacobahyba study in which only general strength training was used. It is generally accepted that the mode of physical activity can influence hormonal responses to exercise training.46 In regard to the unaffected androgens levels in Team C, it is well documented that one strength session per week does not provide sufficient stimulus for TT increase.14,17 Only one recent study with an in-season weekly training regime similar to that of Team C showed an elevation of TT levels at the end of the competitive season.29 The authors suggested that the observed increase in TT was due to the reduction of training volume towards the end of the season. However, this could not be the case in our study since not only in Team C but also in all experimental teams training volume was kept constant until the end of the season. Therefore, the absence of any periodization in training volume, and the low strength training stress employed by this team, most probably accounted for the unaffected TT level throughout the study.
It should be mentioned that the intervention studies which reported significant elevations in TT levels employed only general40 or special strength sessions.17 In our study, we used the combination of two types of strength training, i.e. general and soccer-specific strength sessions. Since it has been well demonstrated that the combination of soccer training with only one strength training per week does not appear to be sufficient to increase the endogenous testosterone production,14,17,29 our findings suggest that it was the weekly combination of one general with two (Team A) or one (Team B) soccer-specific strength sessions provided sufficient stimulus for the significant TT increase in Team A and it was enough for the observed marginally significant elevation of TT in Team B. Despite the lack of publications regarding the relationship between soccer-specific strength and TT levels, the sub-components of the employed soccer-specific strength sessions have been individually studied. This kind of training is composed of various maximal intensity activities, such as repeated sprints in the manner of interval sprint training, eccentric movements (turning, changes of direction, acceleration and deceleration), plyometrics, and squat exercises with or without external weights. It has been found that interval sprint training,13 eccentric resistance training,49 and exercises using large muscle groups such as squats can increase TT levels.48 In regard to plyometric training, it has recently been observed9 that it may decrease, rather than increase, TT levels. However, the authors reported that this reduction of TT was rather the result of accelerated utilization of TT by the tissues and augmented hepatic clearance than compromised endogenous production. Based on these reports, we hypothesize that all these types of training activities which are included in the soccer-specific sessions if combined with general strength sessions could result in a sufficiently high stimulus to elevate TT levels.
The observed changes in TT, apart from the different strength exercise training stress, may also be the result of the metabolic demands elicited by the three training programs employed, each characterized by a specific training volume and load. Indeed, according to a number of published studies,20,43,48 the threshold of TT response appears to be based more on the metabolic demand than on the training regime itself. Extensive literature supports the concept that a linear relationship exists between energy expenditure, and thus metabolic demands, with volume, frequency, and training load.10,26,45 In our study, the TT response appears to be linearly related to each of these parameters. More specifically, the higher volume, load, and frequency of trainings increased TT resting levels in Team A, the moderate strength training stress tended to increase TT in team B, whereas the lowest strength training stress in team C did not have any effect. The observed differences in endogenous androgen responses between teams may well be the result of the different metabolic demands. This observation supports the findings of the aforementioned studies20,43,48 as to a threshold response of TT regarding energy demands since it appears that a linear relationship exist between metabolic demands and changes of TT levels.
Our results demonstrated that none of the three different training programs provided sufficient stimulus to significantly change FT levels. In agreement with our observations is a recent study in professional soccer players reporting that the combination of regular soccer training (composed of two strength training sessions per week) did not affect FT levels.17 Evidence from previous studies on strength trained individuals showed that FT seems to be affected only by heavy resistance exercise of high volume.1,31 This hypothesis is partly validated by our findings. The higher strength training stress program in Team A showed a trend, albeit not statistically significant, of increase in FT levels at the end of the study compared to baseline. No similar trend was observable in the other two teams (lower strength volume) (Table 4, Figure 1). However, this higher strength training program failed to provide sufficient stimulus for a significant increase in FT levels. These different observations between the aforementioned studies1,31 and our own findings could be a result of the difference in strength training volume between the two experimental models and the training status of the subjects, parameters that have been reported to be of paramount significance in the effect of exercise on endogenous androgen production.46
Our data regarding the changes of 3a Diol G during the training period in Team A support our TT findings. The significant changes of 3a Diol G levels detected in this team followed a similar pattern to the changes in TT levels, i.e. its levels increased at mid and end of the season compared to baseline in Team A. This observation suggests that the higher strength training program employed by Team A accelerated both the production and activation rates of testosterone. However, the observed elevation of 3a Diol G, indicative of activated testosterone,34 did not appear to have any statistically significant repercussions on ergometrics, suggesting a more subtle effect. Furthermore, it should be mentioned here that our study is the first involving professional athletes tested for the effect of training on 3a Diol G. The only other available data regarding 3a Diol G response to exercise is from a study performed in elderly and middle-aged men.25 The authors reported that a 12-month training period failed to document any significant change in 3a Diol G levels, a finding which is in agreement with our results obtained from Teams B and C, i.e. from the teams with the lower volume of training. Thus, we postulate that the lower level of strength training stress does not change the rate of testosterone activation in contrast to the higher level of strength training stress used in Team A. The higher training stress in Team A may have induced activation of testosterone, the first step of which is its conversion to its biologically active compound DHT (dihydrotestosterone). This may be responsible for the alterations of the ergometrics that we have observed, since DHT has been shown to be associated with fast twitch muscle fibers, muscle strength, and body fat percentage,50 parameters that directly affect exercise performance.23,35,39 Furthermore, the elevation of 3a Diol G levels indicates a positive anabolic effect, since this metabolite is a marker of the total androgen pool and an indicator of peripheral activation of androgens.34 Overall, the importance of this finding is based on the fact that apart from an induced adaptation leading to increased endogenous TT production at the end of the study in Team A, there was a further unique adaptation, an augmented peripheral activation of testosterone.
In agreement with the majority of the available evidence,4,7,11,17,28,38,42 all examined performance parameters exhibited significant improvements at mid-point compared to baseline in all teams, and this effect was retained until the end of the study. However, only in Team A did we observe a further significant improvement in SJ, CMJ, 10m and 20m capacity in the second half of the study. These considerable improvements in exercise performance until mid-point and their maintenance until the end of the season indices is a result of a combined effect of the pre- and in-season conditioning in conjunction with the competitions’ training stress.7,12,42 Overtraining or suboptimal aerobic loading and lack of sprint and strength sessions can counteract these effects.7,29 However, in our study we had no evidence of any overtraining since “training monotony” values were below the suggested level of two indicatives of overtraining2 (Table 3). In addition, aerobic loading was kept constant throughout the study, while strength and sprint sessions were included in the weekly training plan (Tables 1, 2).
The further enhancement in jumping (SJ, CMJ) and sprinting (10m, 20m) ability in Team A in the second half of the in-season period was most likely a result of the higher employed volume of both SPS and sprint sessions in this team compared to Teams B and C (Table 1). It has recently been suggested12 that a moderate frequency of plyometrics (twice per week), similar to the volume used in our SPS regimes in Team A, is more effective in promoting jumping ability compared to the lower frequency (once per week) used in Teams B and C. Furthermore, a similar weekly sprint training volume (three sessions per week) as that employed by Team A (Table 1) has been found to produce beneficial adaptations in the muscle function, which is translated into an increased SJ and CMJ performance.37 This increased jumping ability could be the reason for the observed increase in sprint performance in Team A. Indeed, it is well established that jumping ability is strongly related to sprint performance41 and, moreover, increases in sprint performance occur concomitantly with the largest increases in jumping ability in soccer players.17,42
Another possible mechanism responsible for this increase in jumping and sprinting ability in the second half of the study in Team A could be related to the reduced BF% in this team during this period (Table 4). Indeed, it has been well demonstrated that both jumping ability and sprint performance improvements are significantly associated with a reduction in BF%.11,39 Moreover, it has previously been reported that competitive soccer players with a lower BF% invariably show better sprint performance.7
In conclusion, our findings suggest that, provided that the volume and load of the training is up to a certain level, a combination of soccer training with general strength and soccer-specific strength training can affect the circulating endogenous androgens TT and 3a Diol G but not FT. Indeed, we have found that the training scheme employed by Team A resulted in an elevation of TT and in a simultaneous increase in its activation as expressed by the elevated levels of 3a Diol G. The observed effects appear to be volume-dependant, since the two teams with the lower volume did not have similar results to those of Team A. As expected, aerobic capacity in all experimental teams increased up to mid-season and thereafter plateau till the end of the competition period. Regarding neuromuscular performance, our findings indicate that despite the differences in the training schemes used, it increased in a similar manner until the first half of the season. Interestingly, the high strength training stress induced a further and significant increase till the end of the competition season. It is our opinion that the elevation of endogenous androgens as a result of the volume of strength training indicates that the only method to improve athletic performance is hard training. There are no substitutes or shortcuts.If the organism needs more androgens it will produce them endogenously.
REFERENCES
1. Ahtiainen JP, Pakarinen A, Alen M, Kraemer WJ, Häkkinen K, 2003 Muscle hypertrophy, hormonal adaptations and strength development during strength training in strength-trained ad untrained men. Eur J Appl Physiol 89: 555-563.
2. Aldercrentz H, Harkonen M, Kuoppasalmi K, et al, 1986 Effect of training on plasma anabolic and catabolic steroid hormones and their response during physical training. Int Sports Med 7: 27-28.
3. Baker D, 1996 Improving vertical jump performance through general, special, and specific strength: A brief review. J Strength Cond Res 10: 131-136.
4. Bangsbo J, 1994 The physiology of soccer: with special reference to intense intermittent exercise. Acta Physiol Scand 15(Suppl): 1-156.
5. Bosco C 1993 Test di valutazione della donna nella pratica del calcio. In: Arri del Confegno Nazionale il Calcio Femminile. Aspetti Medici e Tecnici. FIGC, Frienze; pp. 219-230.
6. Busso T, 2003 Variable dose-response relationship between exercise training and performance. Med Sci Sports Exerc 35: 1188-1195.
7. Caldwell BP, Peters DM, 2009 Seasonal variation in physiological fitness of a semiprofessional soccer Team. J Strength Cond Res 23: 1370-1377.
8. Cardinale M, Stone MH, 2006 Is testosterone influencing explosive performance? J Strength Cond Res 20: 103-107.
9. Crether BT, Cook CJ, Gaviglio CM, Kilduff LP, Drawer S, 2012 Baseline strength can influence the ability of salivary free testosterone to predict squat and sprinting performance. J Strength Cond Res 26: 261-268.
10. Da Silva AI, Fernandes LC, Fernandez R, 2008 Energy expenditure and intensity of physical activity in soccer referees during match-play. J Sports Sci Med 7: 327-334.
11. Davis DS, Barnette BJ, Kiger JT, Mirasola JJ, Young SM, 2004 Physical characteristics that predict functional performance in Division I college football players. J Strength Cond Res 18: 115-120.
12. De Villarreal ES, Gonzalez-Badillo JJ, Izquierdo M, 2008 Low and moderate plyometric training frequency produces greater jumping and sprinting gains compared with high frequency. J Strength Cond Res 22: 715-725.
13. Farzad B, Gharakhanlou R, Agha-Alinejad H, et al, 2010 Effect of 4 Weeks of Supramaximal Sprint Interval Training on Physiological, Hormonal and Metabolic Factors. Iranian Journal of Endocrinology and Metabolism 12: 34-41.
14. Filaire E, Bernain X, Sagnol M, Lac G, 2001 Preliminary results on mood state, salivary testosterone: cortisol ratio and Team performance in professional soccer Team. Eur J Appl Physiol 86: 179-184.
15. Foster C, Hector LL, Welsh R, Schrager M, Grenn MA, Snyder AC, 1995 Effects of specific versus cross-training on running performance. Eur J Appl Physiol Occup Physiol 70: 367-372.
16. Grandi M, Celani MF, 1990 Effects of football on the pituitary-testicular axis (PTA): differences between professional and non-professional soccer players. Exp Clin Endocrinol 96: 253-259.
17. Gorostiaga EM, Izquierdo M, Ruesta M, Iribarren J, González-Badillo JJ, Ibáñez J, 2004 Strength training effects on physical performance and serum hormones in young soccer players. Eur J Appl Physiol 91: 698-707.
18. Griggs RC, Kingston W, Jozefowicz RF, Herr BE, Forbes G, Halliday D, 1989 Effect of testosterone on muscle mass and muscle protein synthesis. J Appl Physiol 66: 498-503.
19. Hackney CA, 1989 Endurance training and testosterone levels. Sports Med 8: 117-127.
20. Häkkinen K, Pakarinen A, 1993 Acute hormonal responses to two different fatiguing heavy resistance protocols in male athletes. J Appl Physiol 74: 882-887.
21. Häkkinen K, Pakarinen A, Alen M, Kauhanen H, Komi PV, 1988 Neuromuscular and hormonal adaptations in athletes to strength training in two years. J Appl Physiol 65: 2406-2412.
22. Häkkinen K, Pakarinen A, Kyröläinen H, Cheng S, Kim DH, Komi PV, 1990 Neuromuscular adaptations and serum hormones in females during prolonged power training. Int J Sports Med 11: 91-98.
23. Hartgens F, Kuipers H, 2004 Effects of androgenic-anabolic steroids in athletes. Sports Med 34: 513-554.
24. Hartman MJ, Clark B, Bembens DA, Kilgore JL, Bemben MG, 2007 Comparisons between twice-daily and once-daily training sessions in male weight lifters. Int J Sports Physiol Perform 2: 159-169.
25. Hawkins VN, Foster-Schubert K, Chubak J, et al, 2008 Effect of Exercise on Serum Sex Hormones in Men: A 12-Month Randomized Clinical Trial Med Sci Sports Exerc 40: 223-233.
26. Hunter GR, Weinsier RL, Bamman MM, Larson DE, 1998 A role for high intensity exercise on energy balance and weight control. Int J Obes (Lond) 22: 489-493.
27. Jackson AS, Pollock Ml, 1978 Generalized equations for predicting body density of men. Br J Nutr 40: 497-504.
28. Kalapotharakos V, Ziogas G, Tokmakidis P, 2011 Seasonal aerobic performance variations in elite soccer players. J Strength Cond Res 25: 1502-1507.
29. Kraemer WJ, French DN, Paxton NJ, et al, 2004 Changes in exercise performance and hormonal concentrations over a Big Ten soccer season in starters and nonstarters. J Strength Cond Res 18: 121-128.
30. Kraemer WJ, Häkkinen K, Newton RU, et al, 1995a Factors in various strength and power performance in men. In: Proceedings of the XVth Congress of the International Society of Biomechanics. Jyväskylä: University of Jyväskylä; pp, 508-509.
31. Kraemer WJ, Häkkinen K, Newton RU, et al, 1999 Effects of resistance training on hormonal response patterns in younger vs. older men. J Appl Physiol 87: 982-992.
32. Kraemer WJ, Patton, JF, Gordon SE, et al, 1995b Compatibility of high-intensity strength and endurance training on hormonal and skeletal muscle adaptations. J Appl Physiol 78: 976-989.
33. Kraemer WJ, Ratamess NA, Fry AC, French DN, 1995c Strength testing. Development and evaluation of methodology. In: Physiological Assessment of Human Fitness. Maud, J and Foster C (eds) Human Kinetics, Champaign, IL; pp, 115-138.
34. Labrie F, Belanger A, Cusan L, Gomez JL, Candas B, 1997 Marked decline in serum concentrations of adrenal C19 sex steroid precursors and conjugated androgen metabolites during aging. J Clin Endocrinol Metab 82: 2396-2402.
35. Larew K, Hunter GR, Larson-Meyer DE, Newcomer BR, McCarthy LP, Weinsier RL, 2003 Muscle metabolic function, exercise performance, and weight gain. Med Sci Sports Exerc 35: 230-236.
36. Manolopoulos E, Papadopoulos C, Kellis E, 2006 Effects of combined strength and kick coordination training on soccer kick biomechanics in amateur players. Scand J Med Sci Sports 16: 102-110.
37. Marcovic G, Jukic I, Milanovic D, Metikos D, 2007 Effects of sprint and plyometric training on muscle function and athletic performance. J Strength Cond Res 21: 543-549.
38. Mercer T, Gleeson N, Mitchell J, 1997 Fitness profiles of professional soccer players before and after pre-season conditioning. In: Science and Football 3, Reilly T, Bangsbo J, Hughes M (eds) London: E and FN Spon; pp, 112-117.
39. Ozkan A, Kayıhan G, Köklü Y, et al, 2012 The Relationship Between Body Composition, Anaerobic Performance and Sprint Ability of Amputee Soccer Players. J Hum Kin 35: 141-146.
40. Pacobahyba N, De Souza Vale RG, De Souza SLP, Simão R, Santos E, Martin Dantas EH, 2012 Muscle strength, serum basal levels of testosterone and urea in soccer athletes submitted to non-linear periodization program. Rev Bras Med Esporte 18: 130-133.
41. Robbins DW, Young WB, 2012 Positional relationships between various sprints and jumps abilities in elite American football players. J Strength Cond Res 26: 388-397.
42. Rønnestad BR, Nymark BS, Raastad T, 2011 Effects of in-season strength maintenance training frequency in professional soccer players. J Strength Cond Res 2011 25: 2653-2560.
43. Smilios I, Pilianidis T, Karamouzis M, Tokmakidis S, 2003 Hormonal responses after various resistance exercise protocols. Med Sci Sports Exerc 35: 644-654.
44. Staron RS, Karapondo DL, Kraemer WJ, 1994 Skeletal muscle adaptations during early phase of heavy-resistance training in men and women. J Appl Physiol 76: 1247-1255.
45. Trappe TA, Gastaldelli A, Jozsi AC, Troup JP, Wolfe RR, 1997 Energy expenditure of swimmers during high volume training Med Sci Sports Exerc 29: 950-954.
46. Tremblay MS, Copeland JL, Van Helder W, 2004 Effect of training status and exercise mode on endogenous steroid hormones in men. J Appl Physiol 96: 531-539.
47. Urhausen A, Gabriel H, Kindermann W, 1995 Blood hormones as markers of training stress and overtraining. Sports Med 20: 251-276.
48. Vingren JL, Kraemer WJ, Ratamess NA, Anderson JM, Maresh CM, 2010 Testosterone physiology in resistance exercise and training: the up-stream regulatory elements. Sports Med 40: 1037-1053.
49. Yarrow JF, Borsa PA, Borst SE, Sitren HS, Stevens BR, White LJ, 2008 Early-Phase Neuroendocrine Responses and Strength Adaptations Following Eccentric-Enhanced Resistance Training. J Strength Cond Res 22: 1205-1214.
50. Yoshioka M, Boivin A, Ye P, Labrie F, St-Amand J, 2006 Effects of dihydrotestosterone on skeletal muscle transcriptome in mice measured by serial analysis of gene expression. J Mol Endocrinol 36: 247-259.
Address for correspondence:
A.N. Margioris, Laboratory of Clinical Chemistry – Biochemistry, Department of Laboratory Medicine, School of Medicine, University of Crete, Heraklion GR- 71003, Crete, Greece. Tel.: +30-2810-394588, Fax: +30-2810-394571, E-mail: andym@med.uoc.gr
Received 05-08-2013, Accepted 18-02-2014